

Green Fundamentals: Renewables achieve maximum power
Data-driven discussion of climate technology, finance, and policy

I provide data-driven climate tech market analysis. Follow along to stay up to date!
In California, 100% renewable power is a major success and unlocks new, more difficult challenges
What Happened: For most of the last month, renewable energy has supplied 100% of California’s energy demand (albeit not for the full day). In the middle of the day (when the sun is shining), total demand (light blue line below) was surpassed by renewables (stacked area graph below for solar + wind + hydro + nuclear).
In the evenings, gas and coal generation (black line) is needed to offset the decline in solar supply and meet demand. Batteries can store electricity when supply exceeds demand and provide power later in the day (green line). There is still a 40%+ gap in the evenings and mornings for renewable supply to meet demand.
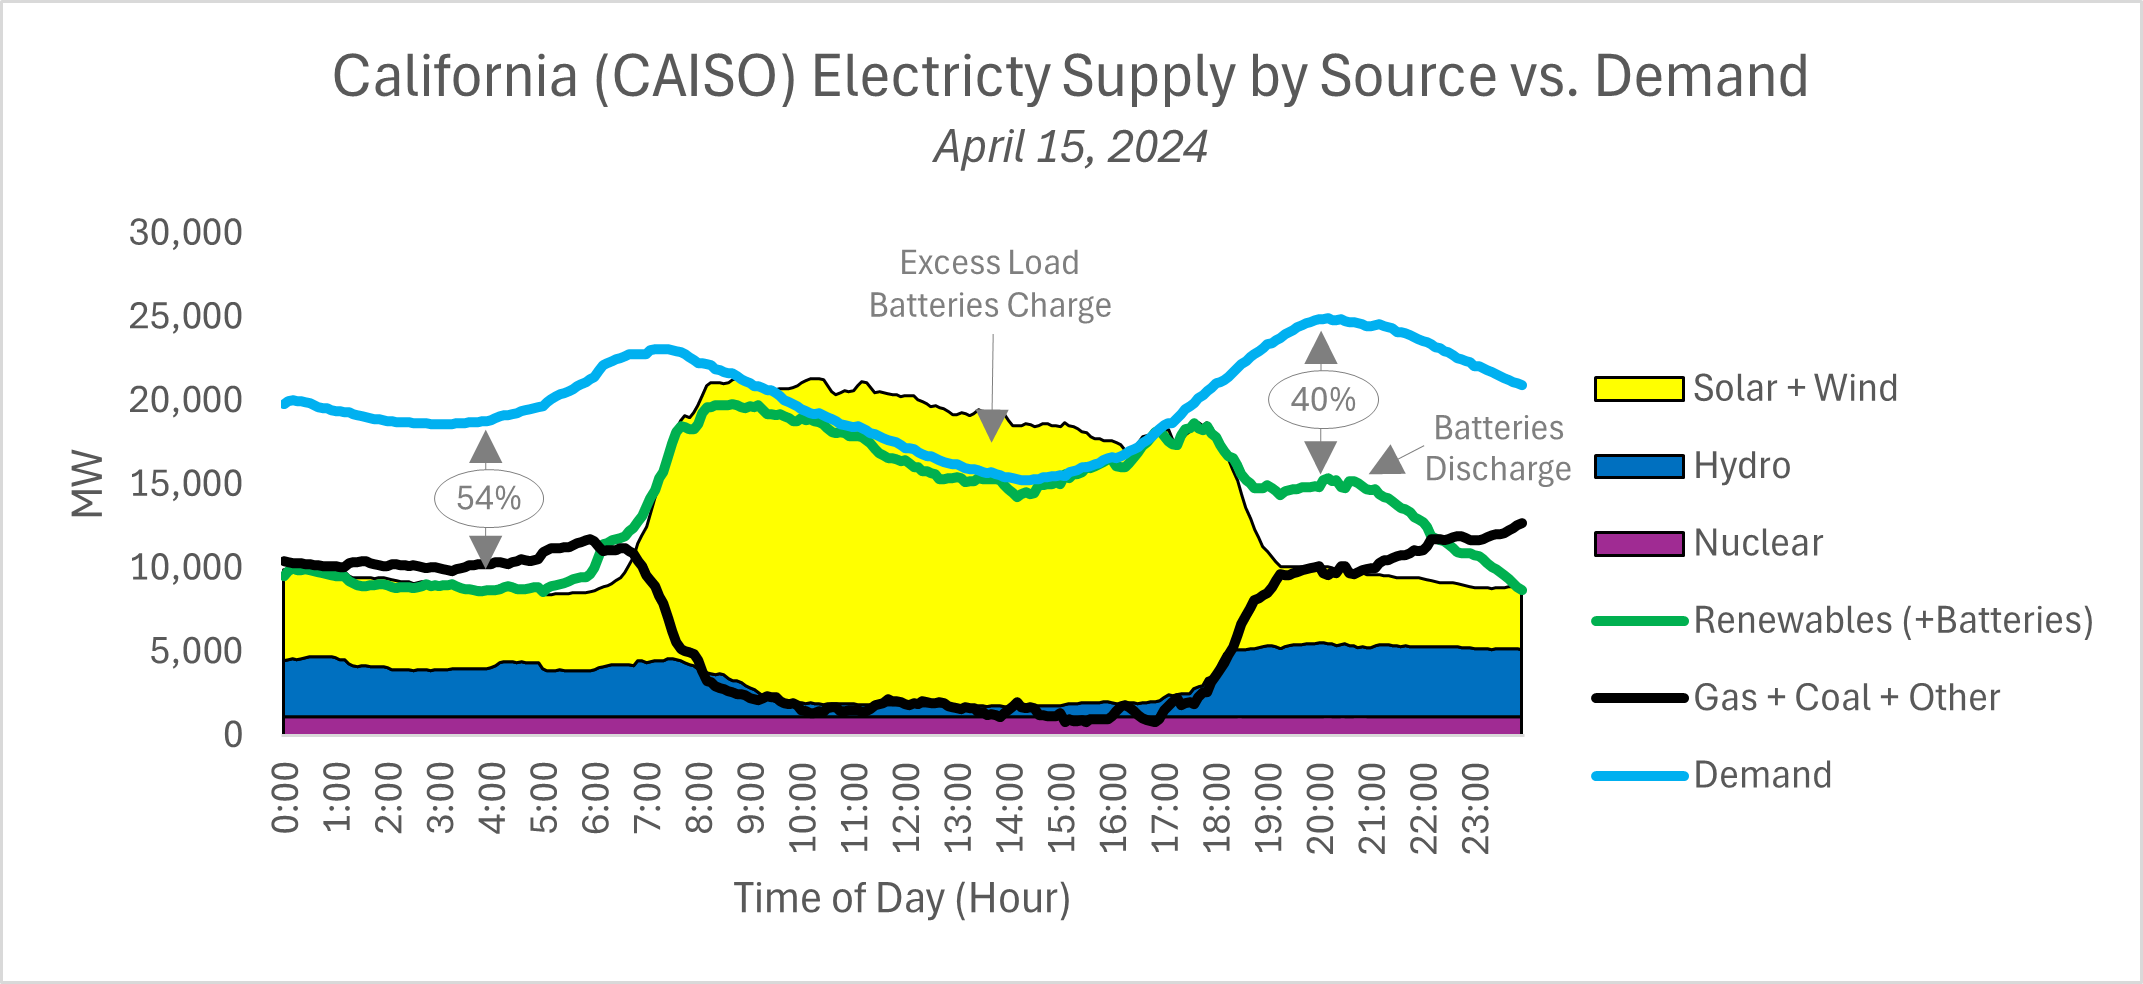
Source: CAISO data
Background: Storage makes excess supply in peak periods valuable when the sun goes down. But storage is far too costly, and this may drive up the cost of incremental renewable capacity.
Short-duration storage (<8 hours) is needed to store excess renewables generation from mid-day and supply it at night. On average it costs $150-300+ / MWh to store electricity for 2-8 hours. Essentially, the utility is paying $150-300 to store $40 worth of electricity (the levelized cost of solar).
Long-duration storage (>100 hours) is needed to store excess renewable generation from the summer (or fall) and supply it in the winter. For these longer periods, storage is very expensive (possibly as high as $20,000 per MWh).
Solar is more productive in the summer than winter - so 100% capacity in the summer is still below capacity in the winter. Though some new capacity has come online, the graph below from December illustrates this point. The effect is even greater in markets with more distinct seasons.

Source: CAISO data
Other markets (like Texas) will have a much easier (and more profitable) path to deploy more renewables. Texas electricity demand does not dip in the middle of the day (known as the ‘Duck Curve’) due to less prevalent residential solar, more industrial consumption using 24x7 power, and other factors. Texas electricity demand is higher (~2.5x California’s) and so is its current solar + wind supply (~2.4x). Because Texas has more wind, it has a longer runway to deploy more renewables without needing storage.
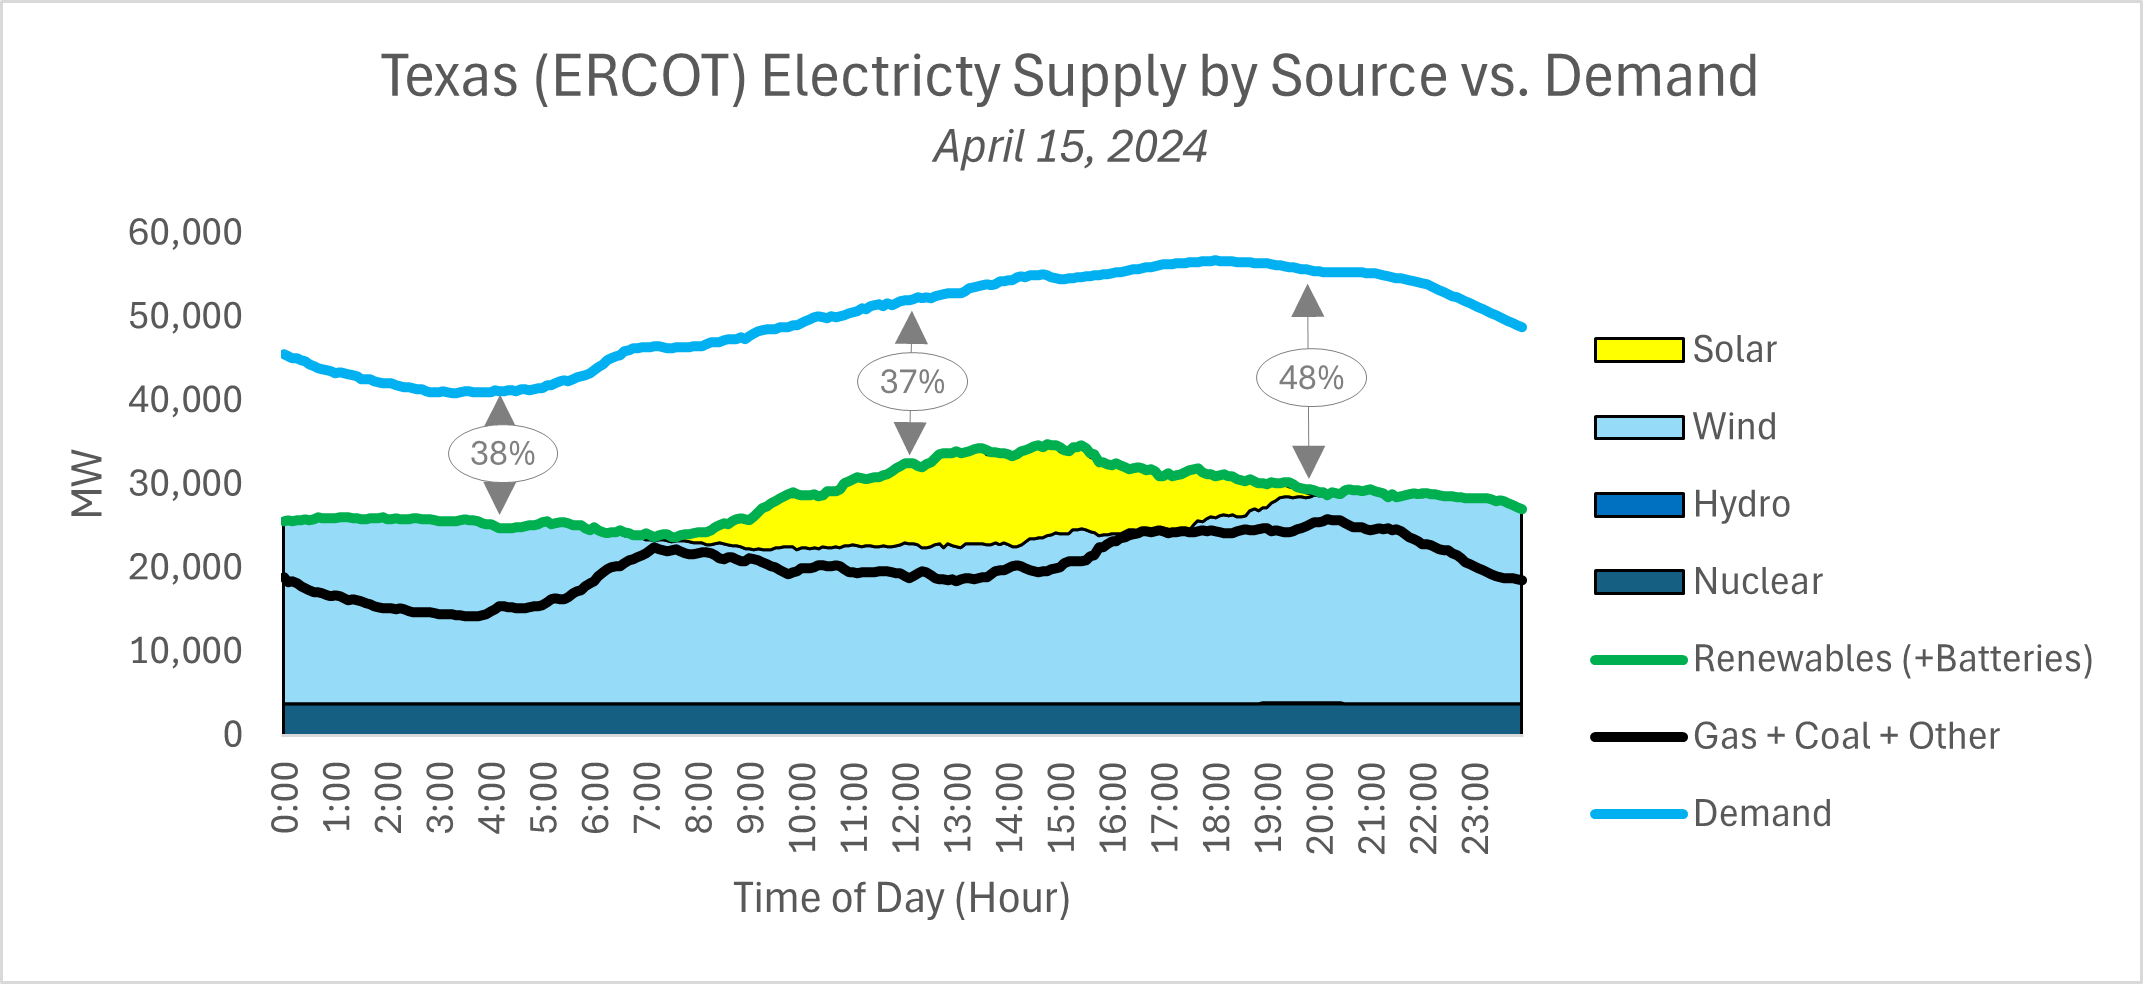
Source: ERCOT data
Take-Away: In California, much of the ‘low hanging fruit’ for solar has been built. Storage will be key for continued renewables deployment. For most markets, there is a significant runway to invest in low-cost solar and wind and sell to the grid without the need for high cost storage. But every market will hit this inflection point, one day.
What Comes Next: California will have to address excess production without harming renewable project attractiveness. How California navigates the next phase of challenges will set the path for others to follow. As markets reach this inflection point, look for:
Solar projects may need to significantly rely on 'exports’ from CAISO and sell to other utilities as they exceed existing battery capacity in California (which faces transmission challenges assuming we continue to fall short of a unified western electricity market)
Utilities may need to curtail solar supply (‘turn off’) and harm project economics if transmission / demand is a constraint (already, transmission related curtailment in California is at an all-time high) - this could slow down new deployment
Large storage projects may be deployed to take advantage of peak loads (the Edwards Sanborn project is now fully online, the Alta Wind Battery has been approved) and may drive up electricity costs
Offshore wind projects are in the pipeline but have hit setbacks due to tribal rights, transmission costs, and technology concerns - and new ‘dispatchable’ projects like geothermal may be of greater interest (nuclear is unlikely in California) despite technology risks and geographic constraints
Further Reading
Technology (Deep Tech, Materials Science, Emissions)
Shipping: Wind-assisted vessels could make commercial shipping climate-friendly (PBS)
Batteries: World's Largest Battery Manufacturer Labels Solid-State Technology 'Unsafe' (Car Buzz)
Emissions: Global warming is coming for your home: Who will pay for the damage? (The Economist)
Private Markets (PE / VC / Real Estate / Infra)
Utilities: Texas Gets a Spring Energy Scare (WSJ)
Data Centers: Microsoft says Georgia may be overestimating data center load growth (Latitude Media)
Solar: Can’t Blame IRA: Prevailing wage requirements have no impact on large project costs (Solar Builder)
Carbon Removal: World’s largest carbon removal plant is about to open (E&E News)
Data Centers: AI revolution will be boon for natural gas, say fossil fuel bosses (FT)
Public Markets (Stocks, Bonds)
Data Centers: Data Center REIT Equinix Inks Deal To Buy Nuclear Power From Sam Altman-Backed Firm (BISNOW)
Off-Shore Wind: Dominion Energy Launches First Jones Act-Compliant Offshore Wind Turbine Installation Vessel (ON&T)
Batteries: National Grid ‘throttling’ battery storage development with underuse (Financial Times)
Interest Rates: Powell Dials Back Expectations on Rate Cuts (WSJ)
Government & Policy
Tax Credits: ‘The market is definitely moving on 45X credits’, says Crux CEO (PV Tech)
Tax Credits: Carbon Credits Market to Get a Huge Boost as Rules Relaxed - SBTi says credits can now be used to reduce Scope 3 emissions (Bloomberg)
Nuclear Fusion: US, Japan announce partnership to accelerate nuclear fusion (Reuters)
Nuclear Fission: Senators to launch caucus promoting advanced nuclear reactors (E&E News)
Trade: Joe Biden calls for tripling of tariffs on Chinese steel (Financial Times).
Geothermal: Geothermal could revolutionize American energy. Will polarization threaten its rise? (The Hill)

Top 10 EV / NTM Gross Profit Multiples
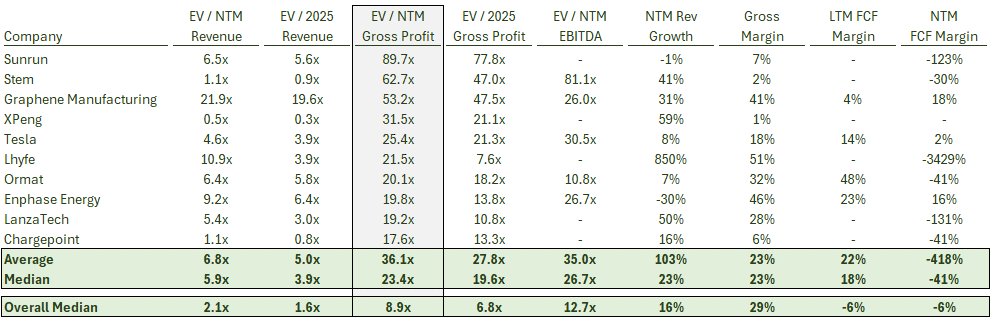
See footnote for detailed valuation methodology and explanation.1
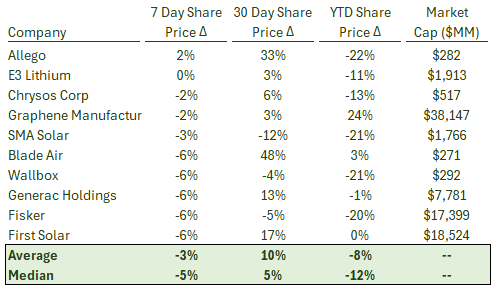
Top 10 Weekly Share Price Movement
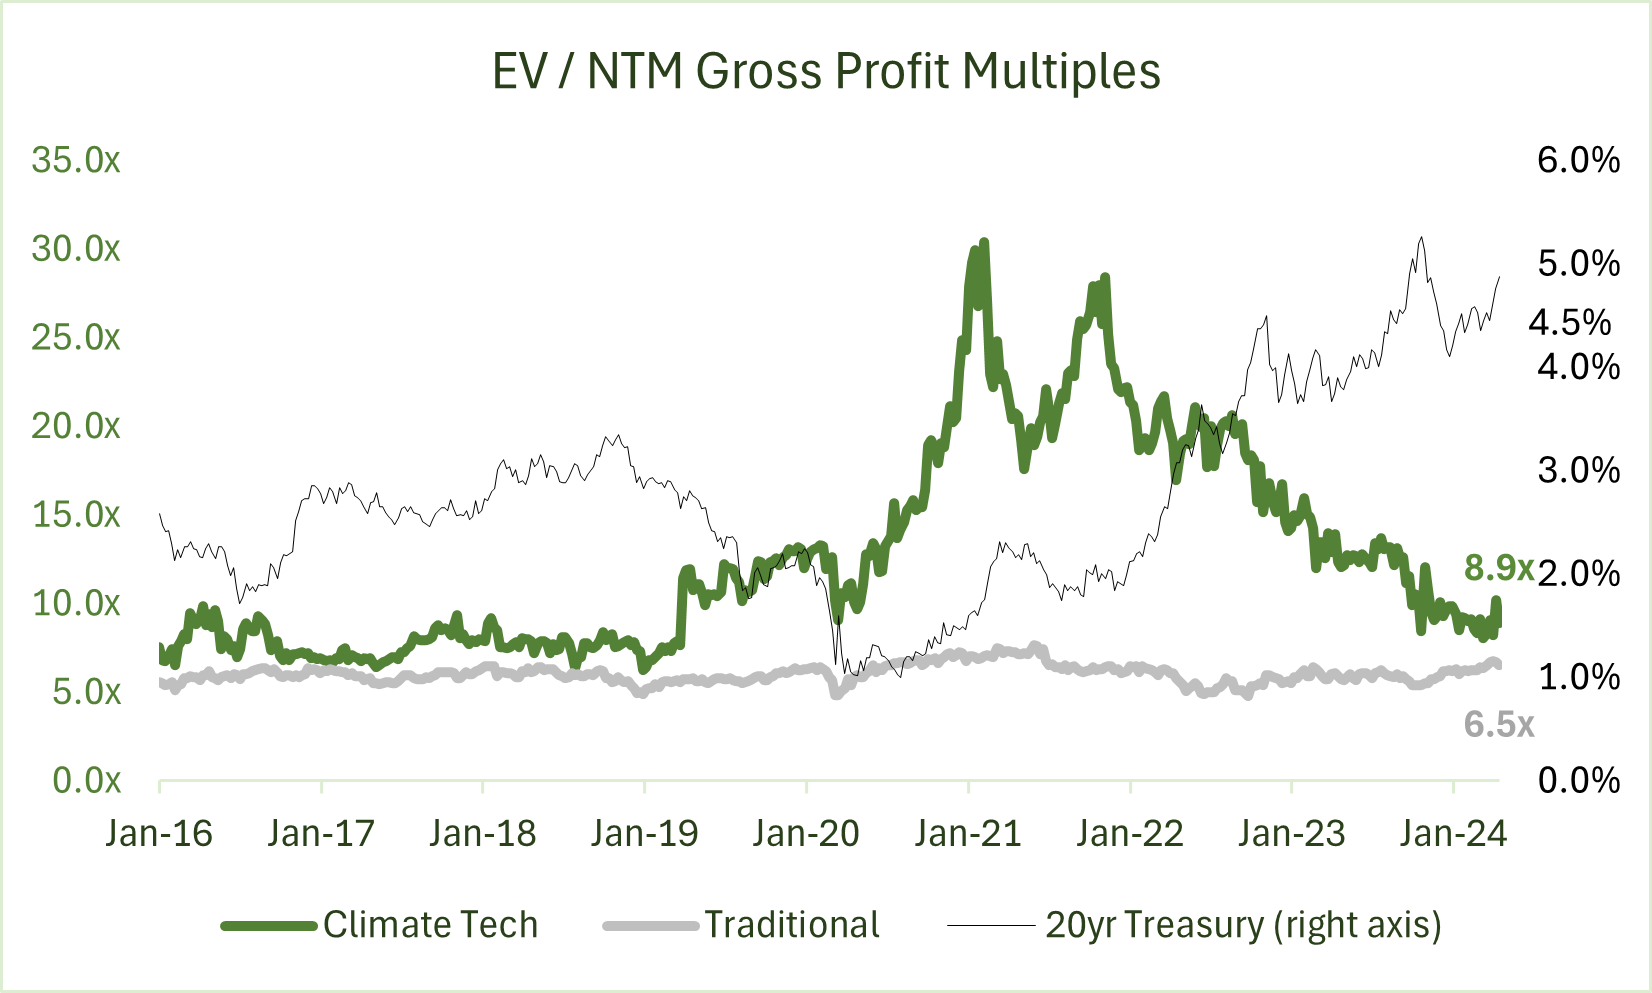
Valuation Multiples over Time
Take-Away: As interest rates have increased, valuations of growth-focused climate tech have declined (similar to other growth-focused industries like cloud software), reducing the premium to their near-term focused, traditional industry peers.
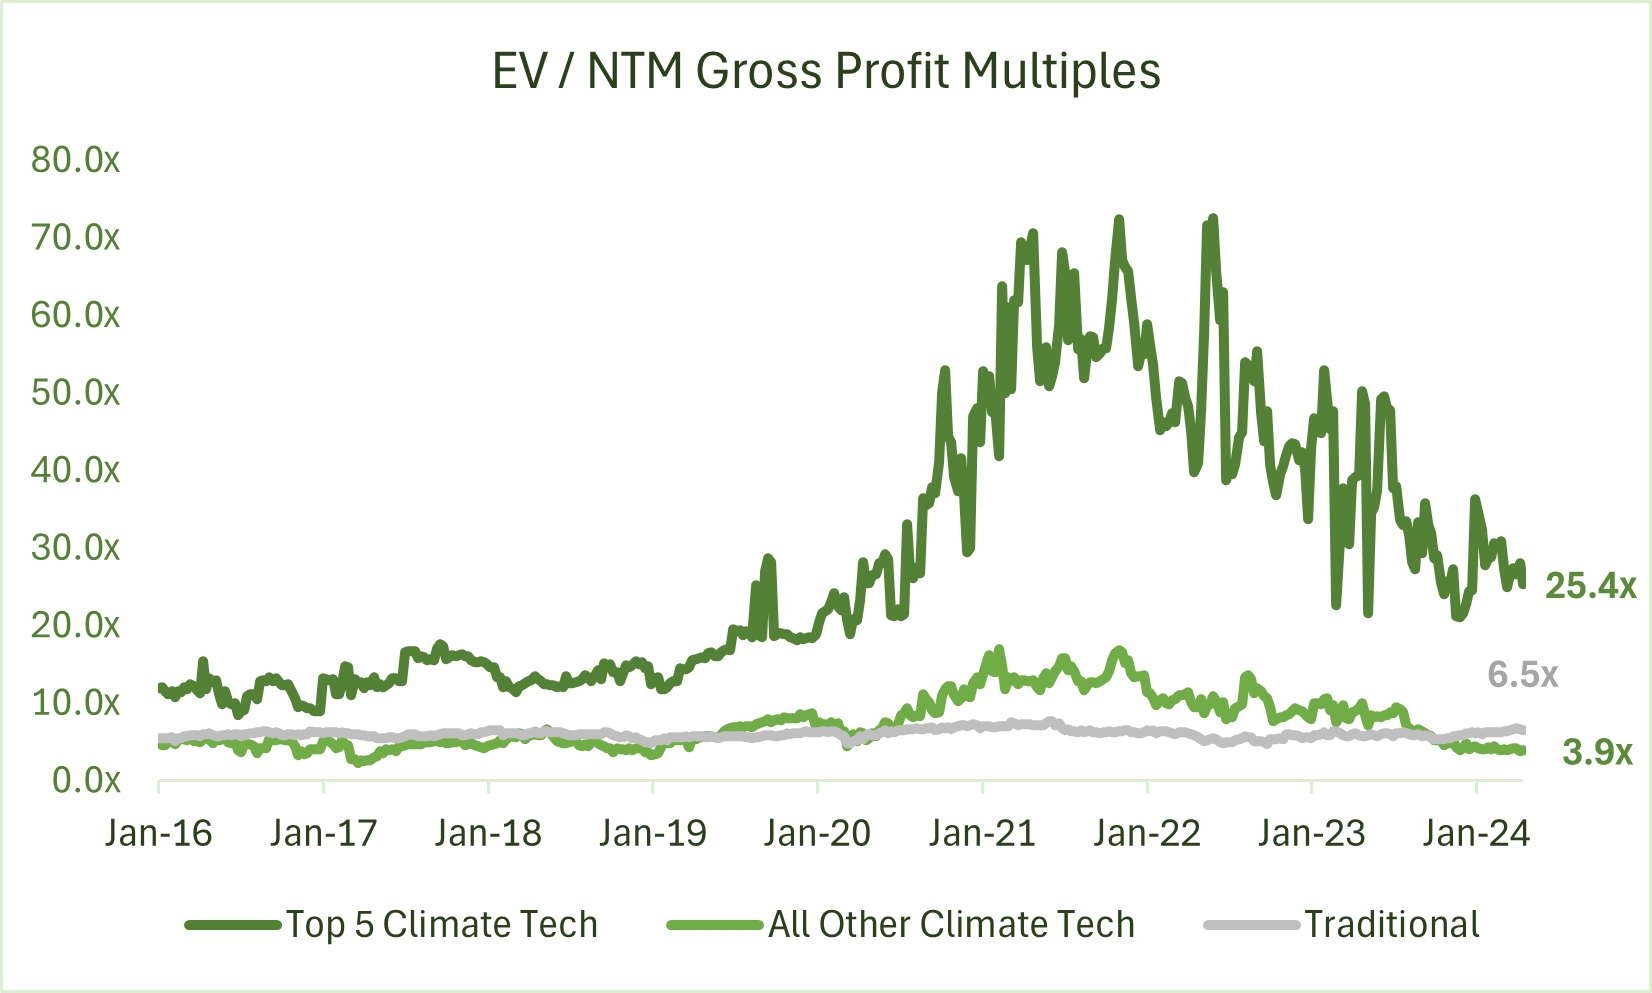
Take-Away: The Top 5 Climate Tech companies account for all of the premium Climate Tech has over Traditional Industries.
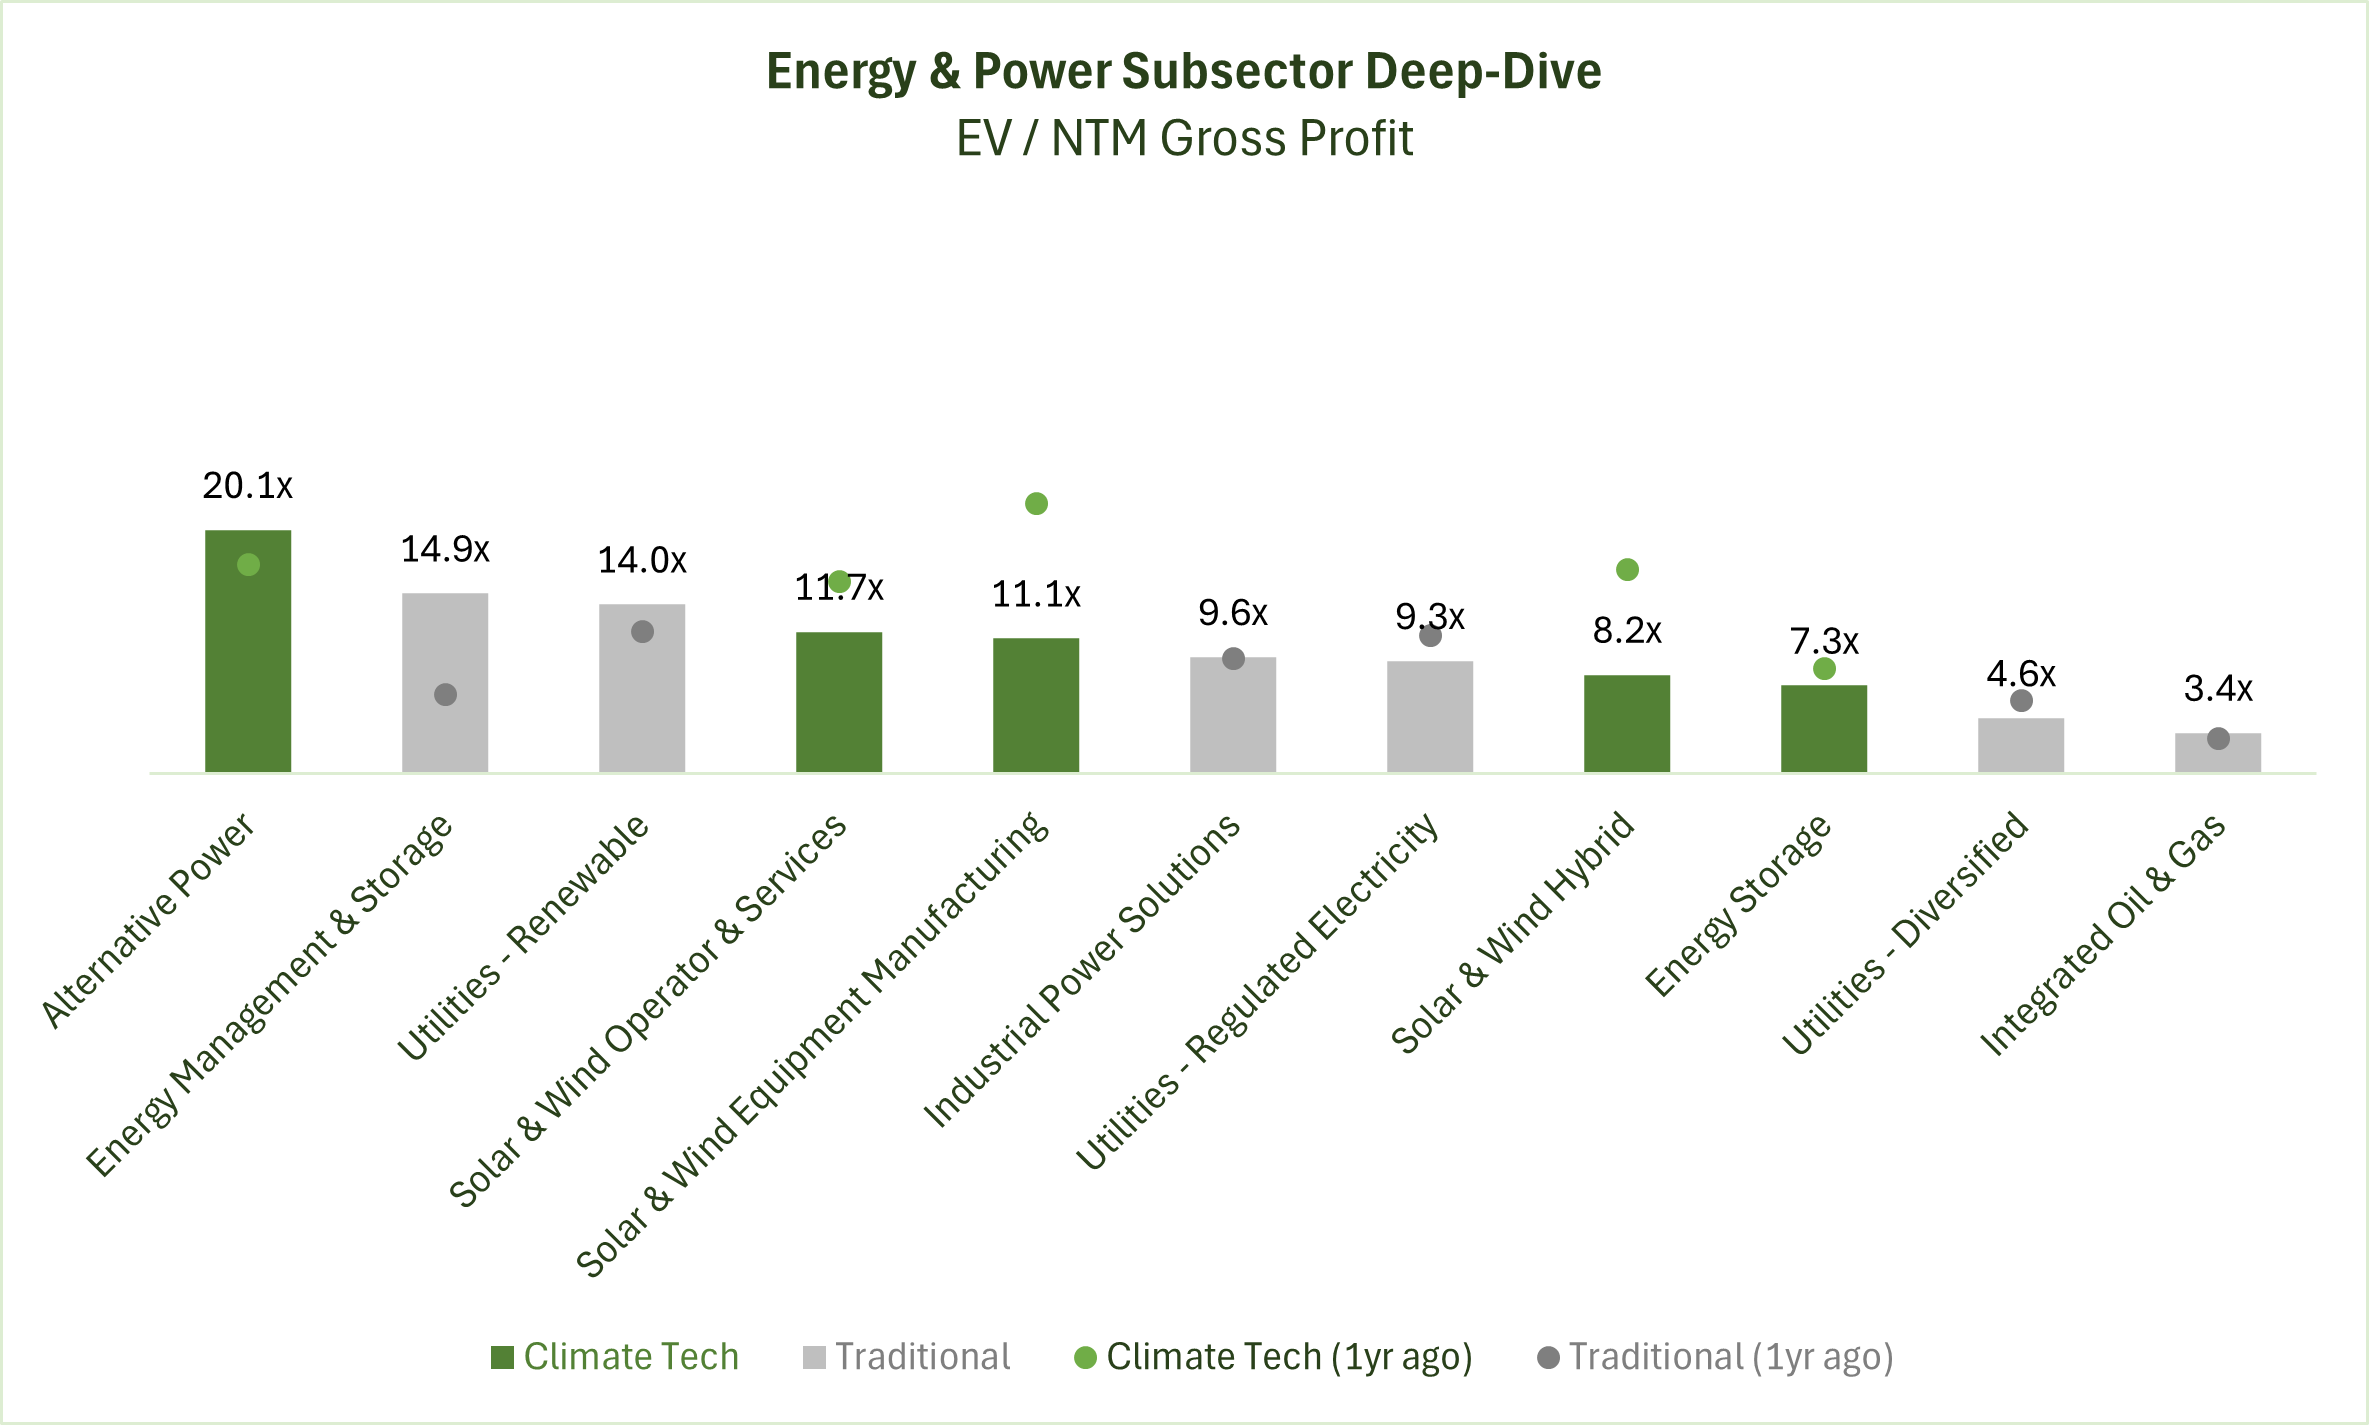
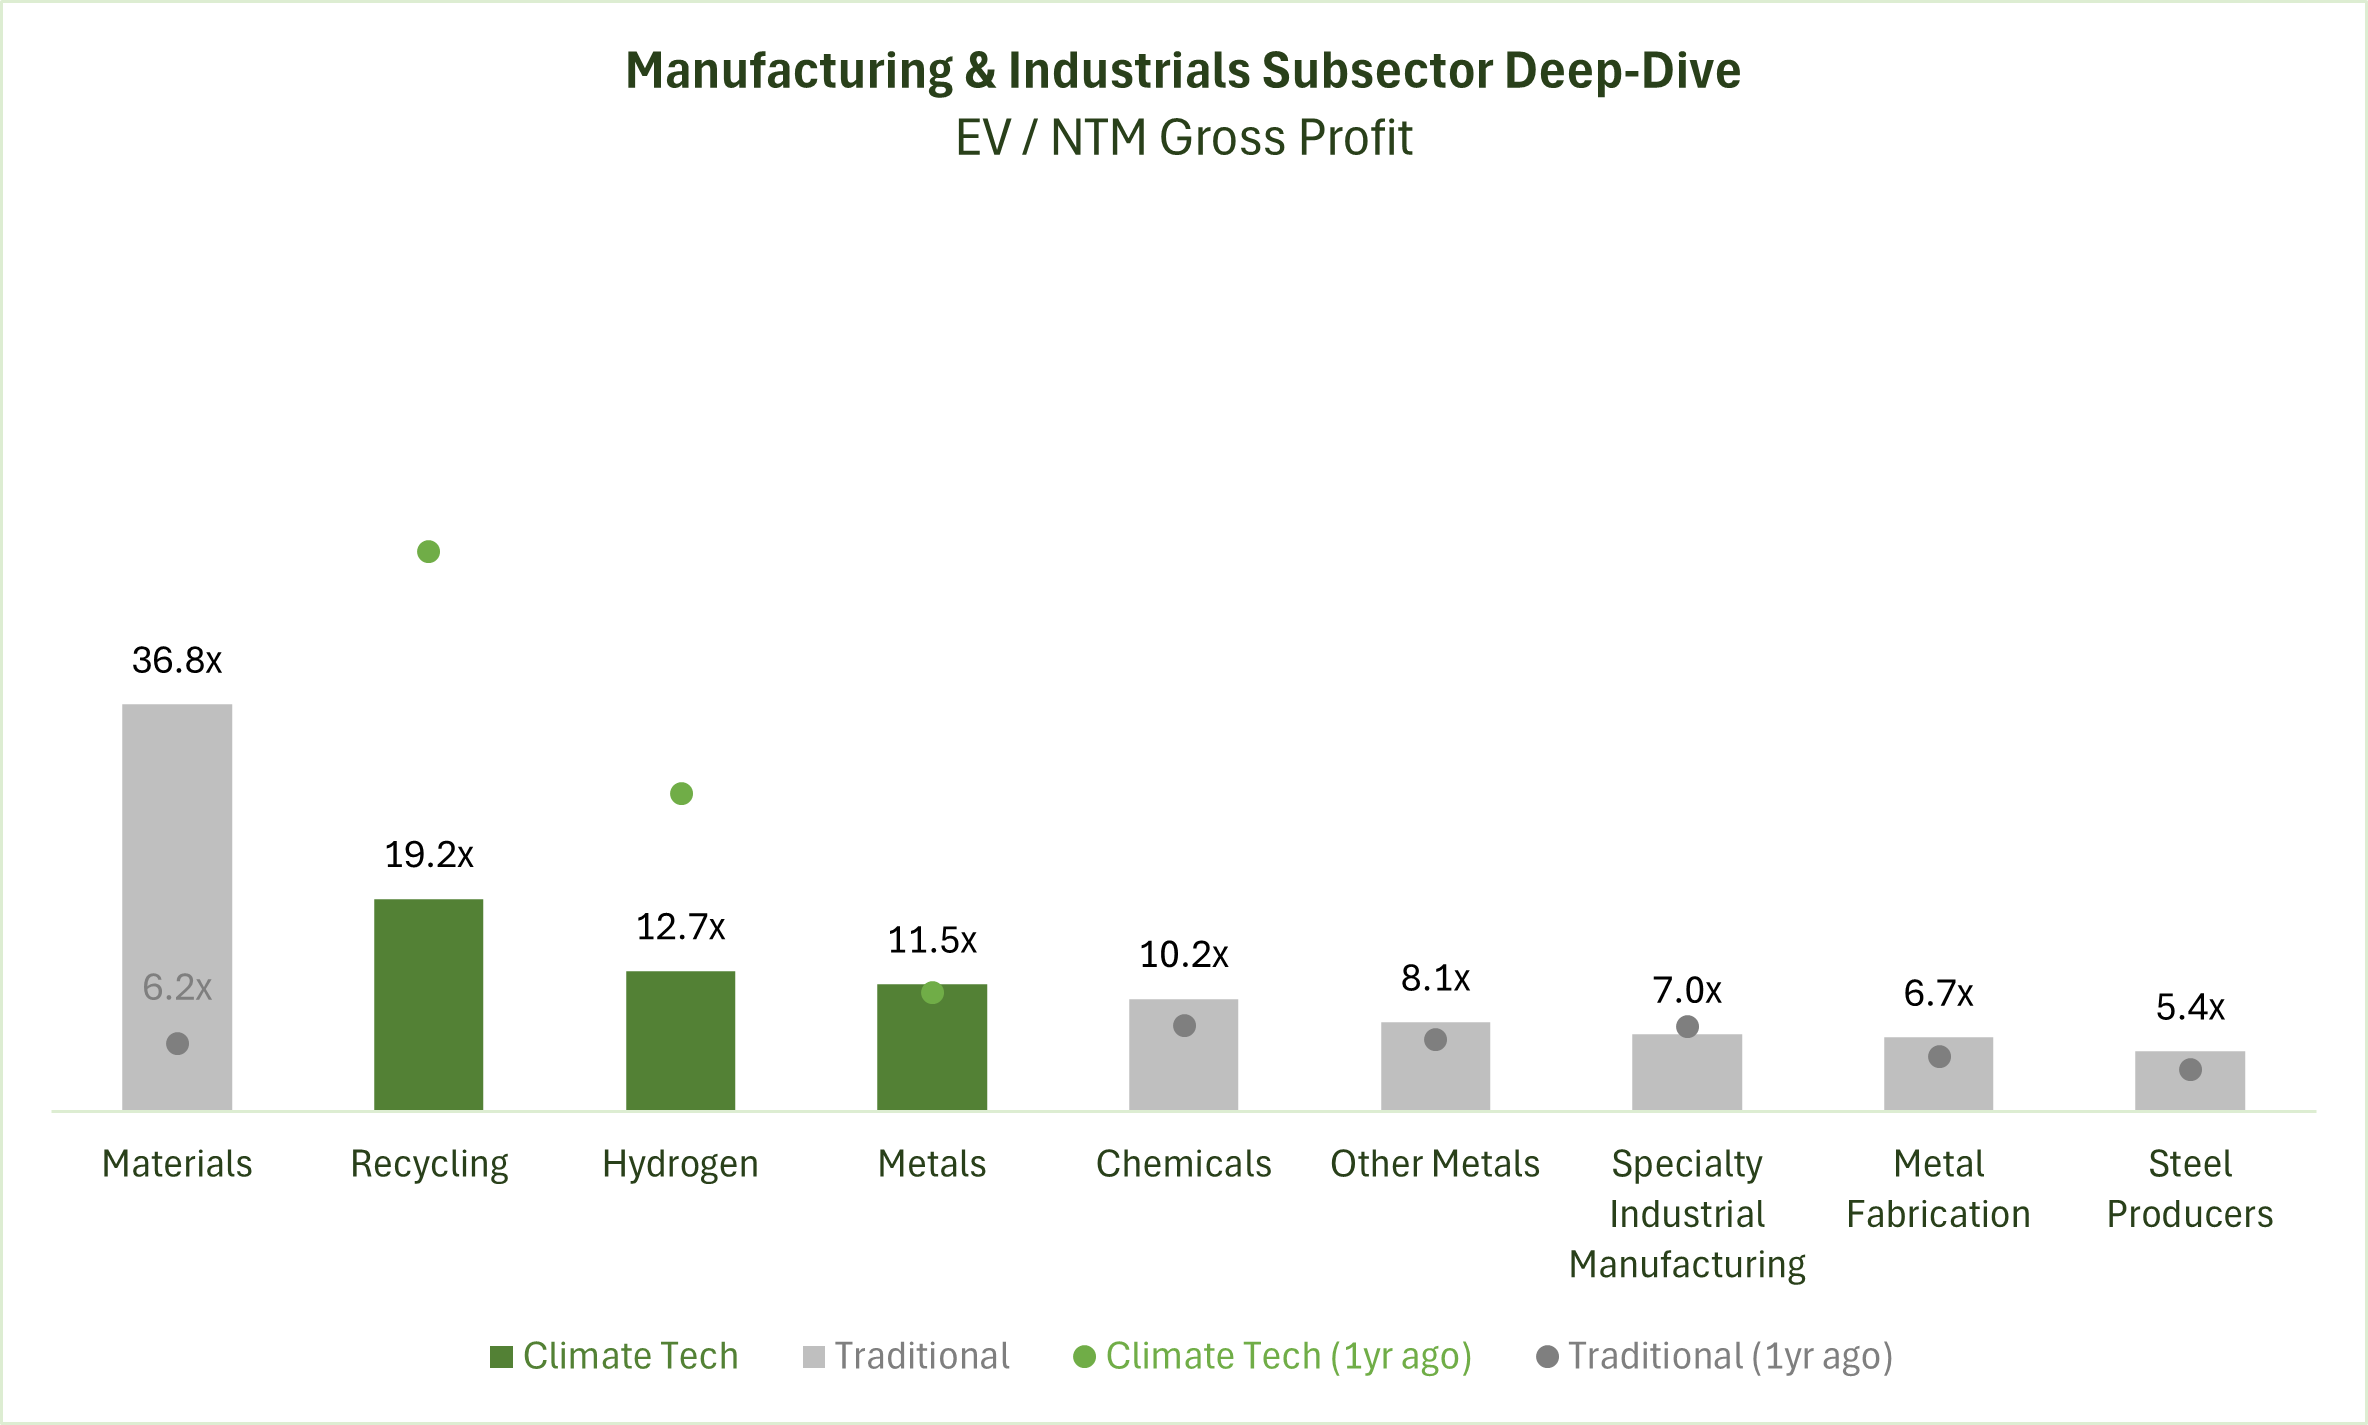
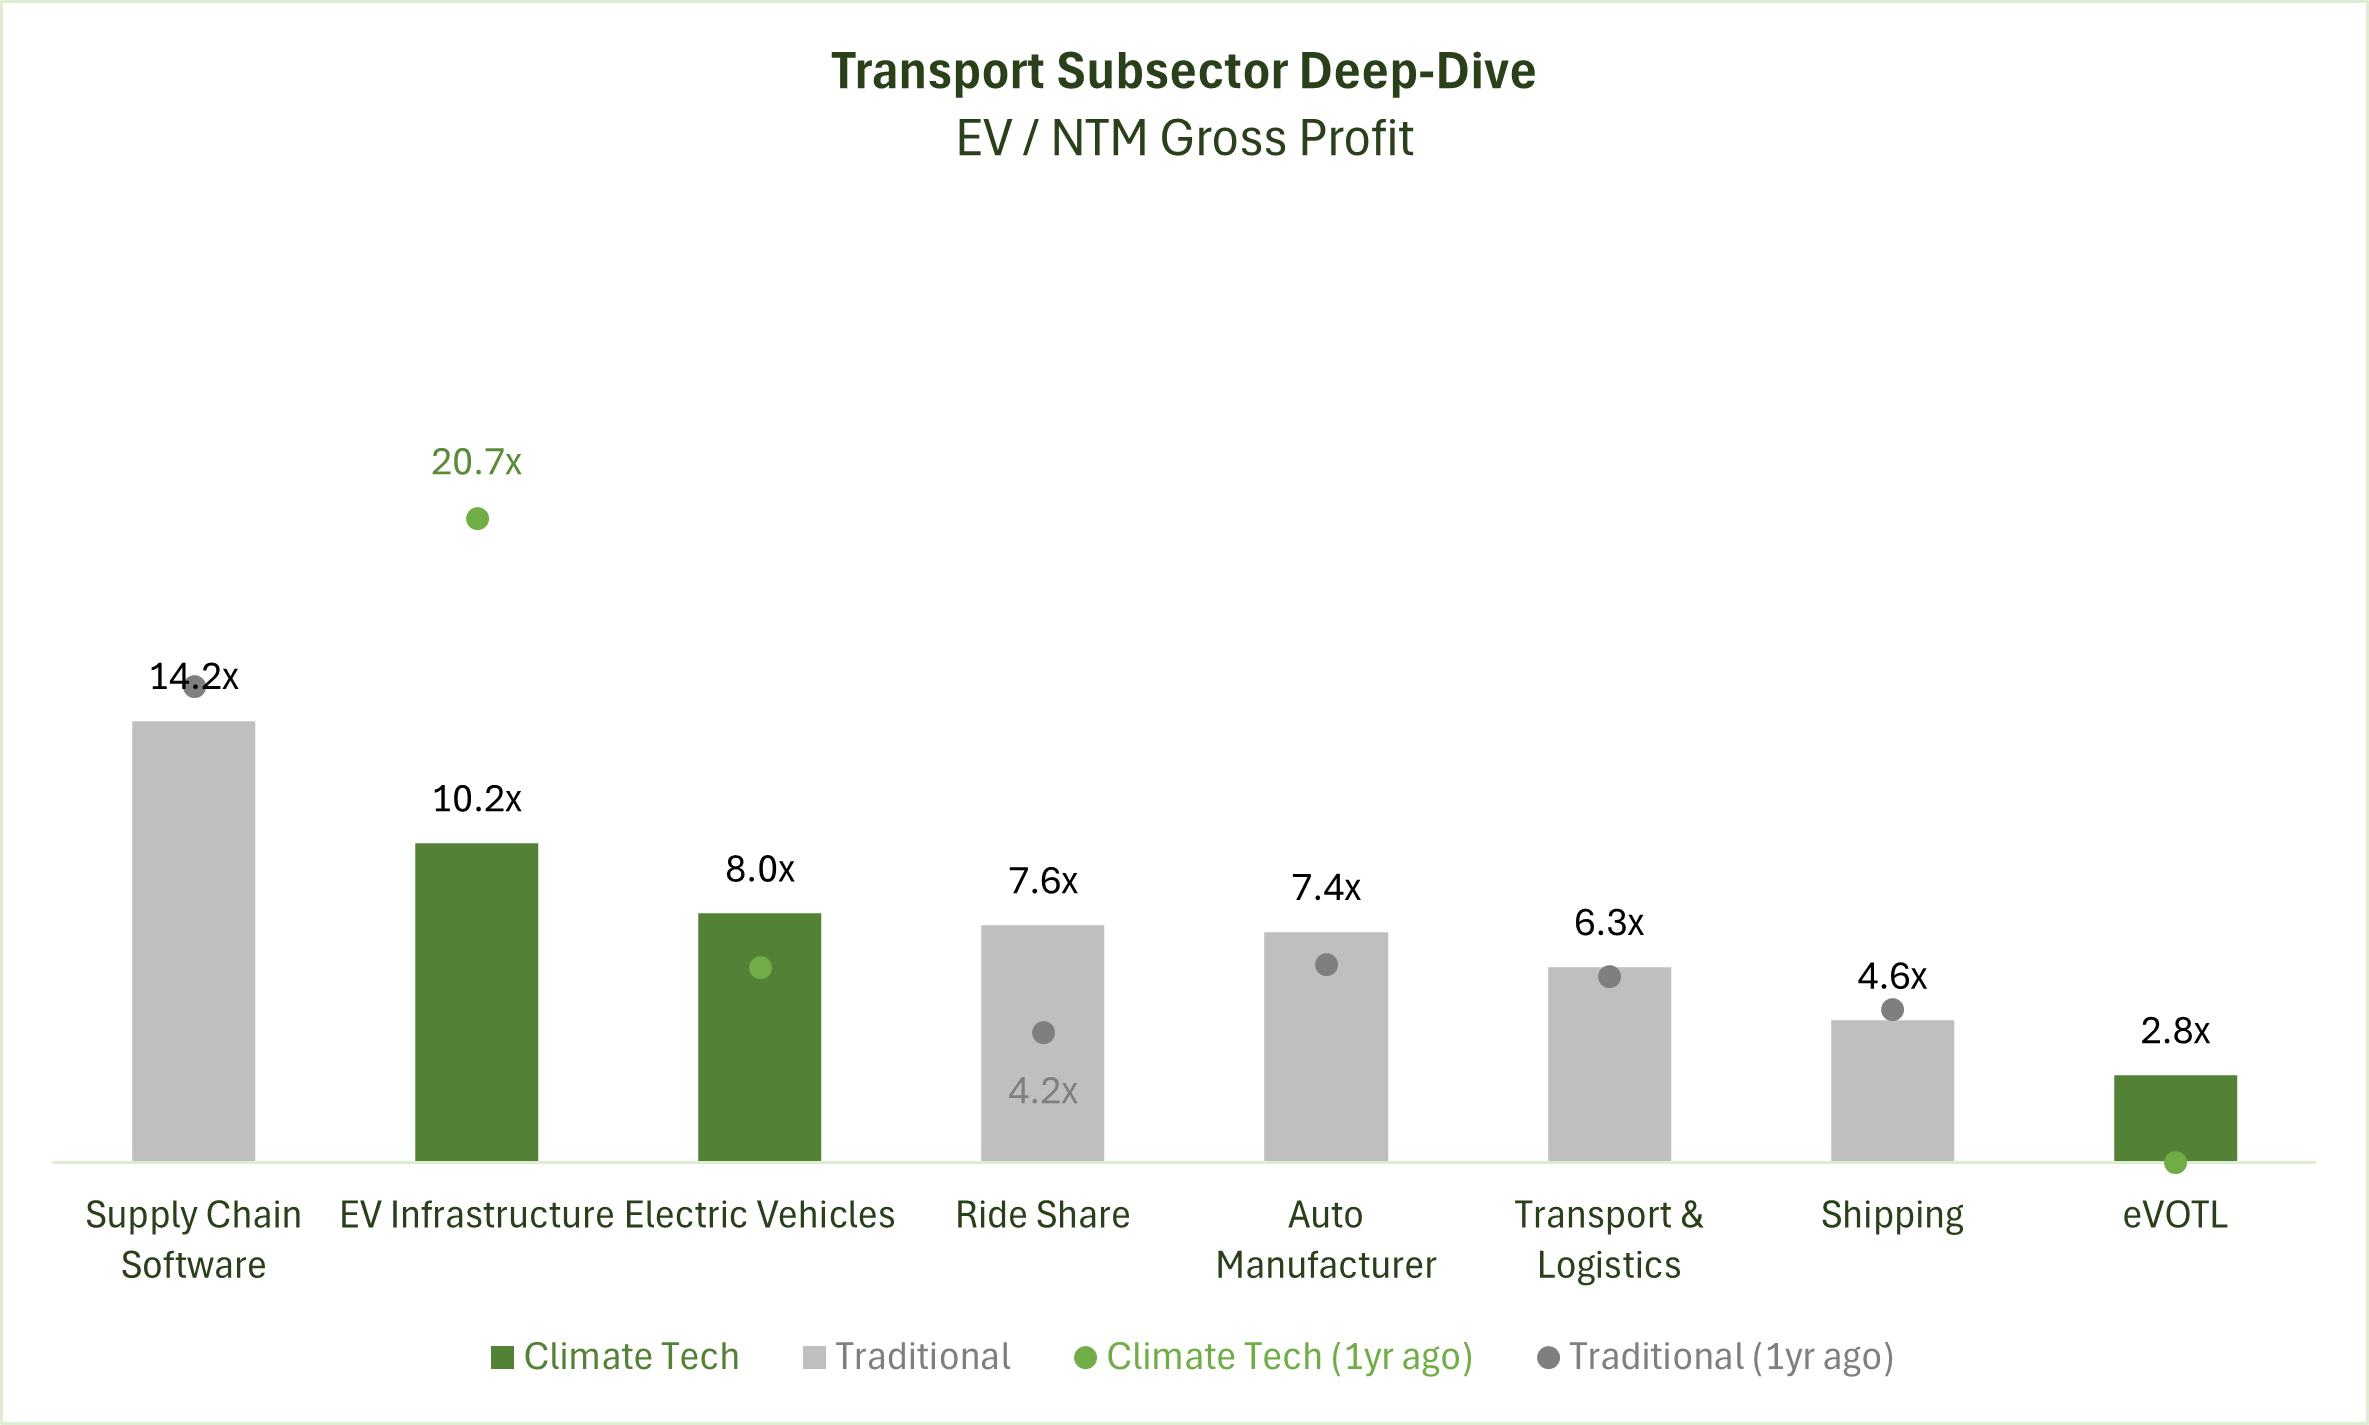
Deep-Dive by Subsector
Energy & Power: Mature and bankable climate tech (pure-play solar & wind, alt. power) commands a higher premium, while more speculative (storage) has less; the market is more skeptical on hybrid solar & wind business models (combining manufacturing with services or operations).
Manufacturing & Industrials: Both traditional and emerging companies around critical minerals supply command a premium; the market has grown skeptical on hydrogen.
Transport: EV growth is priced in to climate tech and traditional companies; the market is skeptical on eVOTL.
Detailed Comparison Set Data
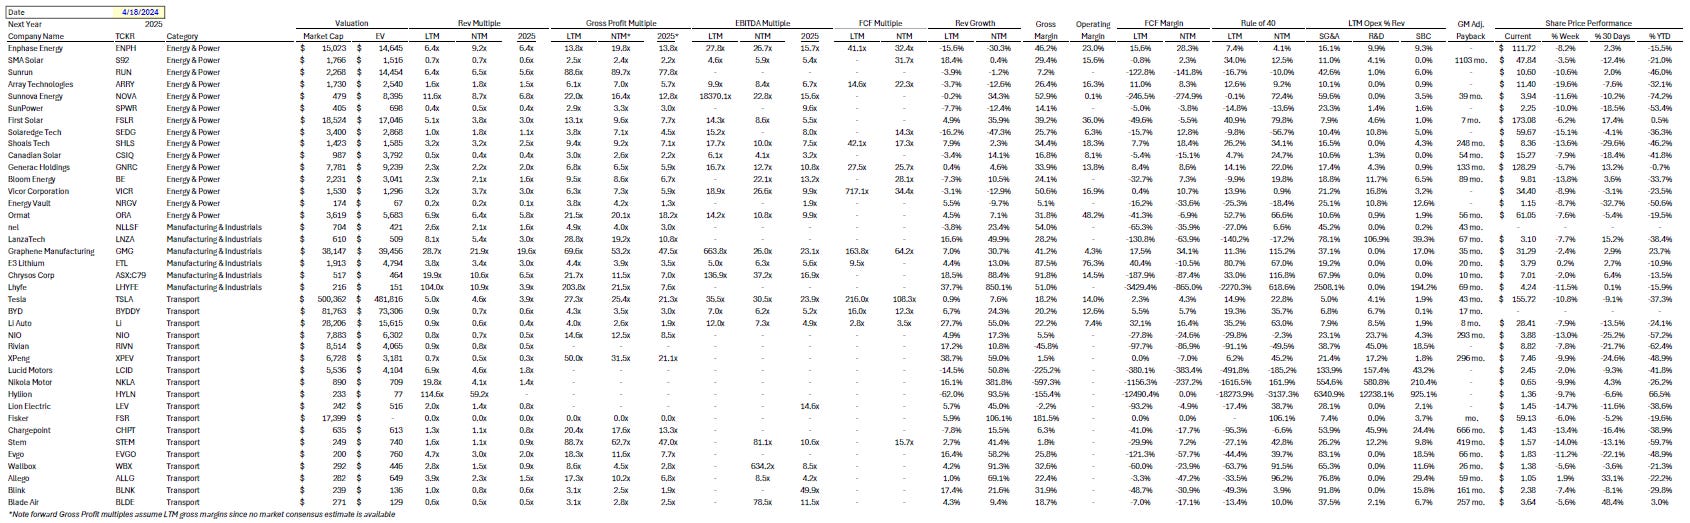
Sources include news articles cited (above) and publicly available SEC filings.
While technology companies are typically valued on Next Twelve Months (NTM) Revenue, traditional industrial businesses are often valued on Last Twelve Months (LTM) EBITDA. Due to the varied business models across climate tech (and the fact that many of the companies are not yet EBITDA positive) valuation multiples here are calculated based on Next Twelve Months (NTM) Gross Profit.
‘Climate Tech’ includes (1) any pure-play climate technology company that (2) has more than $200M market cap and (3) has positive revenue as well as gross profit (see sector deep dives for full list). ‘Traditional’ includes legacy market participants in relevant sectors (see sector deep dives for full list).
This post and the information presented are intended for informational purposes only. The views expressed herein are the author’s alone and do not constitute an offer to sell, or a recommendation to purchase, or a solicitation of an offer to buy, any security, nor a recommendation for any investment product or service. While certain information contained herein has been obtained from sources believed to be reliable, neither the author nor any of his employers or their affiliates have independently verified this information, and its accuracy and completeness cannot be guaranteed. Accordingly, no representation or warranty, express or implied, is made as to, and no reliance should be placed on, the fairness, accuracy, timeliness or completeness of this information. The author and all employers and their affiliated persons assume no liability for this information and no obligation to update the information or analysis contained herein in the future.