


Green Fundamentals: Giving Credit Where Taxes Are Due
Data-driven discussion of climate technology, finance, and policy

I provide data-driven climate tech market analysis. Follow along to stay up to date!
Transferable Tax Credits Are Scaling, But Political Risk Adds Uncertainty… And Opportunity
The transferable tax credit market has exploded, reaching $30 billion in 2024, with emerging technologies accounting for 67% of supply. 45X tax credits for advanced manufacturing now dominate, surpassing 33% of the market, while wind PTCs have plummeted. Despite concerns about political risk, market participants continue to buy credits, often at a discount, to hedge risk and participate in upside. Investors should focus on high-confidence sectors like nuclear and domestic manufacturing, which have bipartisan support.
New Data on the 2024 Transferable Tax Credits
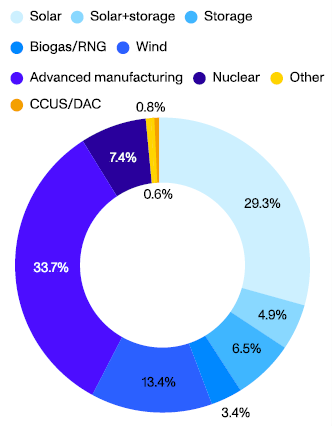
The market for transferable tax credits tripled in size in 2024, reaching nearly $30 billion in total deal volume. This surge wasn’t just a function of growth—it reflected a fundamental shift in the types of tax credits being transacted. According to recent data, emerging technologies accounted for 67% of tax credit supply by the second half of the year.
Among these, advanced manufacturing production tax credits (45X) saw the most dramatic rise, becoming the single largest segment, comprising more than 33% of total supply. This happened despite the IRS only finalizing guidance on 45X in November. Meanwhile, traditional wind PTCs saw their market share shrink from 33% in the first half of the year to just under 3% in the second half.
Source: Crux Transferrable Tax Credit Market Intelligence Report
The growth of 45X credits highlights the role of transferability in financing projects that lack access to traditional tax equity. Projects in sectors like nuclear, bioenergy, geothermal, and carbon capture benefitted significantly from this structure. Nuclear tax credits alone accounted for 12% of the market in the back half of the year.
Despite political uncertainty, the market has remained resilient. Even in the wake of the 2024 election, tax credit demand remained strong, with bidding activity peaking in the fourth quarter. A large share of buyers focused on forward-year credits (2025 and 2026), reflecting confidence in the market’s durability.
Tax Equity Before the IRA
Historically, monetizing tax credits required complex partnerships between developers and tax equity investors. The Partnership Flip Structure was the most widely used tax equity structure, especially in wind and solar. A tax equity investor would provide capital in exchange for the majority of tax benefits in the project's early years. Once a predefined return threshold was met (typically in 5-10 years), ownership would "flip," granting the developer majority control while the investor retained a minority stake. This structure allowed investors to monetize tax credits efficiently while ensuring developers eventually regained control of their assets.

Source: Bloomberg New Energy Finance
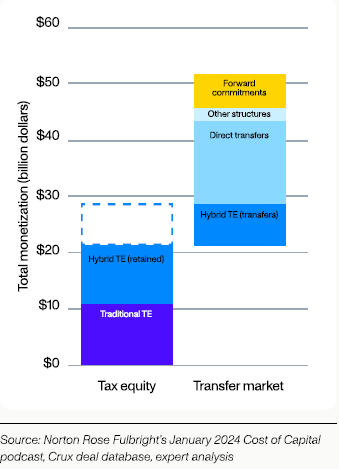
These structures concentrated tax equity deals among a small group of banks with large tax liabilities. As a result, many projects, particularly in emerging technologies, struggled to secure tax equity financing. Standalone energy storage, biofuels, and advanced manufacturing were often excluded altogether. Now, direct pay has nearly doubled the total market size for monetizing project tax credits.

Source: Reunion
How the IRA Changed Tax Equity
The Inflation Reduction Act (IRA) revolutionized the tax equity market by allowing developers to sell their credits directly to buyers—eliminating the need for tax equity partnerships in many cases. Now there can be a direct sale of the tax credits to a purchaser without the need for tax equity (though there are more sophisticated structures that can allow for both).

Source: White & Case
The most notable impact was that a broader range of projects could now monetize tax credits, including smaller developers and industries that previously lacked access. Additionally, any company with tax liability could now purchase credits, expanding the buyer pool beyond traditional tax equity investors.
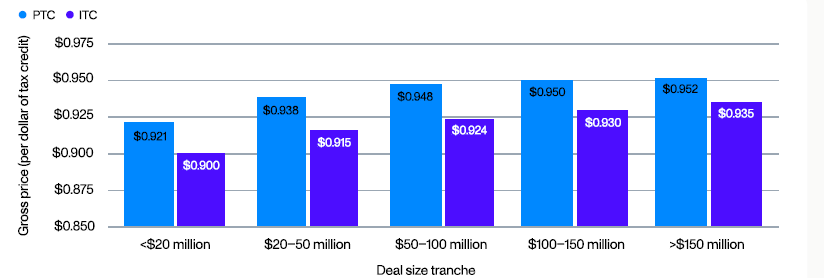
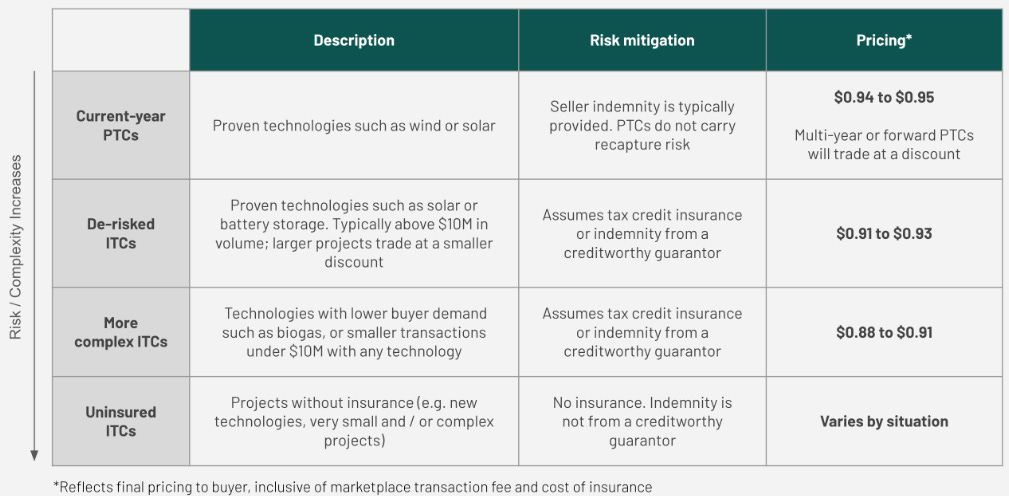
Tax credits are now frequently sold at a discount. Buyers typically pay less than face value, with the discount depending on the perceived risk of the project. This provides them a margin of safety while allowing participation in the project’s upside. Transfer pricing in 2024 has remained relatively stable, with transaction values varying appropriately based on project-specific risk. Lower-risk projects, such as operational solar and wind farms, command higher prices, while emerging technology credits, like those for bioenergy and advanced nuclear, trade at greater discounts.
Source: Crux Transferrable Tax Credit Market Intelligence Report
Source: Reunion Market Insights
Uncertainty remains around forward financing. Developers looking to secure debt backed by the future sale of tax credits still face challenges, as the market lacks established norms for pricing forward commitments. Since transferable credits are only monetized after a project generates them, financing construction remains a challenge. Some developers struggle to align capital needs with when tax credits can be sold.

Source: Crux Transferrable Tax Credit Market Intelligence Report
Uncertainty Going Forward
The IRA’s tax credits have helped catalyze trillions in private investment, but with a potential repeal or rollback looming, the market’s future remains uncertain. The biggest risks include:
Targeted rollbacks under a second Trump administration: Wind and solar credits would likely face the most scrutiny. Offshore wind, in particular, has already been impacted by executive orders halting new leases and permits.
Changes to credit eligibility or bonus provisions: Provisions such as the domestic content adder and energy community bonuses could be on the chopping block, which would disproportionately impact certain states and regions.
Increased IRS scrutiny and regulation: While audits weren’t a primary concern for market participants in 2024, a shift in enforcement could add friction to the tax credit market.

Source: Aurora Energy Research
Despite these uncertainties, demand for transferable credits remains robust, particularly in sectors like nuclear and manufacturing. If political risks remain manageable, 2025 could be another record-setting year for the market. However, if legislative threats materialize, tax credit pricing could become volatile, especially for forward-year commitments.
What Investors Need to Know
For investors, the growth of the transferable tax credit market presents both opportunities and risks:
Opportunities in 45X and Advanced Manufacturing: With 45X tax credits now the largest segment of the market, investment in domestic supply chains—including batteries, solar, and critical minerals—is accelerating. Manufacturing-focused funds should explore direct participation in this space.
Buying Credits at a Discount: Large corporations with tax liabilities can secure high-quality credits at a discount, improving their returns. Expect pricing spreads to remain tied to project risk and policy stability.
Navigating Uncertainty: Political risks loom, but the broad investor participation in 2024 suggests confidence in the market’s resilience. Smart investors will hedge by focusing on sectors with bipartisan support, such as nuclear and U.S.-based manufacturing.
Challenges with Forward Financing: The lack of standardized pricing on forward commitments makes debt-backed deals harder to structure. Investors should factor this into capital planning and project timelines.
In short, the market remains investable but requires strategic positioning. Those who navigate the risks effectively will find opportunities in an expanding, increasingly liquid tax credit market.

Top 10 EV / NTM Gross Profit Multiples
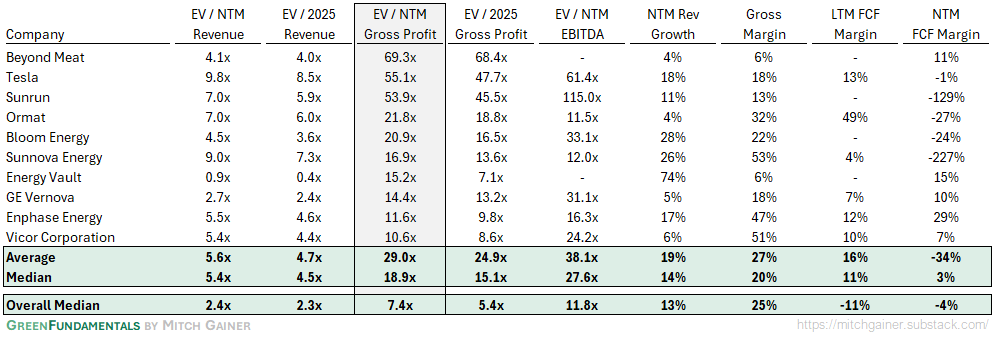
See footnote for detailed valuation methodology and explanation.1
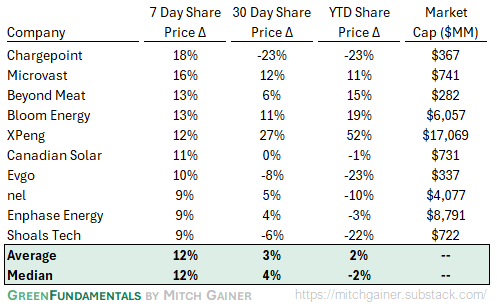
Top 10 and Bottom 10 Weekly Share Price Movement

Valuation Multiples over Time

Deep-Dive by Subsector
Detailed Comparison Set Data


Sources include news articles cited (above) and publicly available SEC filings.
While technology companies are typically valued on Next Twelve Months (NTM) Revenue, traditional industrial businesses are often valued on Last Twelve Months (LTM) EBITDA. Due to the varied business models across climate tech (and the fact that many of the companies are not yet EBITDA positive) valuation multiples here are calculated based on Next Twelve Months (NTM) Gross Profit.
‘Climate Tech’ includes (1) any pure-play climate technology company that (2) has more than $200M market cap and (3) has positive revenue as well as gross profit (see sector deep dives for full list). ‘Traditional’ includes legacy market participants in relevant sectors (see sector deep dives for full list).
This post and the information presented are intended for informational purposes only. The views expressed herein are the author’s alone and do not constitute an offer to sell, or a recommendation to purchase, or a solicitation of an offer to buy, any security, nor a recommendation for any investment product or service. While certain information contained herein has been obtained from sources believed to be reliable, neither the author nor any of his employers or their affiliates have independently verified this information, and its accuracy and completeness cannot be guaranteed. Accordingly, no representation or warranty, express or implied, is made as to, and no reliance should be placed on, the fairness, accuracy, timeliness or completeness of this information. The author and all employers and their affiliated persons assume no liability for this information and no obligation to update the information or analysis contained herein in the future.