

Green Fundamentals: Paradigm Shift in PJM
Data-driven discussion of climate technology, finance, and policy

I provide data-driven climate tech market analysis. Follow along to stay up to date!
PJM's capacity market shake-up is an opportunity for savvy investors and a warning to electrification optimists
What Happened: In late July, PJM Interconnection announced the results of its latest capacity auction, revealing a significant surge in prices across the board. In some areas, prices have more than doubled, signaling a fundamental shift in power market dynamics. This sharp increase reflects a tightening supply-demand balance in the PJM region, driven by a confluence of retiring generation assets, delays in new capacity projects, and escalating demand due to electrification and more frequent extreme weather events.
Background: As the largest grid operator in the United States, PJM manages electricity flow across 13 states and Washington, D.C., serving over 65 million people. The capacity auction is a critical tool PJM uses to secure future reliability by ensuring enough power plants are available during peak demand periods. The latest auction results indicate growing challenges in balancing supply and demand, offering both risks and opportunities for investors.
The PJM region is currently grappling with a significant supply-demand imbalance. Several key factors contribute to this:
Coal Retirements: Since 2015, PJM has seen over 20 GW of coal-fired capacity retire, with another 15 GW potentially retiring by 2030.
Nuclear Decommissioning: Nuclear plants, crucial for zero-emission baseload power, are also under economic pressure, leading to the decommissioning of units like Three Mile Island (2019) and Oyster Creek (2018).
Delayed Projects: These retirements are exacerbated by delays in bringing new capacity online, particularly from renewables. PJM's interconnection queue is backlogged with over 250 GW of proposed projects, many delayed due to interconnection challenges, supply chain disruptions, and regulatory hurdles.
Increasing Demand: Electrification, particularly in transportation and heating, coupled with more frequent extreme weather, is driving up electricity demand. PJM's peak load forecast has been revised upward, now expecting 1.5% annual growth over the next decade, compared to earlier estimates of 1%.

Source: PJM Load Analysis Subcommittee
Maintaining adequate reserve margins is crucial for grid stability and directly impacts electricity prices. A reserve margin, the extra capacity available beyond peak demand, provides a critical buffer to absorb unexpected outages or demand spikes. For example, if PJM forecasts a peak demand of 150,000 MW and has 174,000 MW of available capacity, the reserve margin would be 16%. As PJM's reserve margins tighten due to coal and nuclear retirements, delayed new capacity, and rising demand, electricity prices are climbing sharply. Accurate peak demand forecasts are essential; underestimating demand risks blackouts, while overestimating it can lead to higher costs for maintaining surplus capacity. As more intermittent renewables are integrated, maintaining these margins will require strategic investments in flexible resources like battery storage to ensure grid reliability.
Take-Away: The surge in PJM capacity prices is a clear signal of what lies ahead for power markets. Investors must adjust their strategies to navigate this evolving landscape, where reliability and flexibility are paramount.
Potential Winners:
Existing Gas-Fired Power Plants: Positioned to benefit from higher capacity prices, gas plants are increasingly becoming the backbone of PJM's reliability strategy, crucial during peak demand periods.
Battery Storage: With the intermittency of renewables, battery storage's ability to store and dispatch power as needed makes it a valuable asset. Investors should look for opportunities in utility-scale battery storage projects.
Renewables Paired with Storage: Hybrid projects that combine renewables with storage are likely to gain favor, offering both clean energy and reliability in a market with rising capacity prices.
Potential Losers:
Standalone Renewable Projects: Without storage, these projects may struggle in a market that values reliability, facing challenges due to intermittency issues.
Energy-Intensive Industries: Rising electricity prices could impact their competitiveness, especially if they cannot pass on these increased costs to consumers.
Regulated Utilities Without Flexibility: Utilities reliant on aging coal or nuclear plants without modernization plans may face higher costs and regulatory pressures, leading to potential financial challenges.
What Comes Next: As the PJM market evolves, investors who focus on assets offering both reliability and flexibility will be well-positioned to capitalize on emerging opportunities. The capacity market dynamics highlighted by the recent auction results are a harbinger for broader changes across the grid, demanding strategic foresight and adaptability from market participants.

Top 10 EV / NTM Gross Profit Multiples

See footnote for detailed valuation methodology and explanation.1
Top 10 and Bottom 10 Weekly Share Price Movement


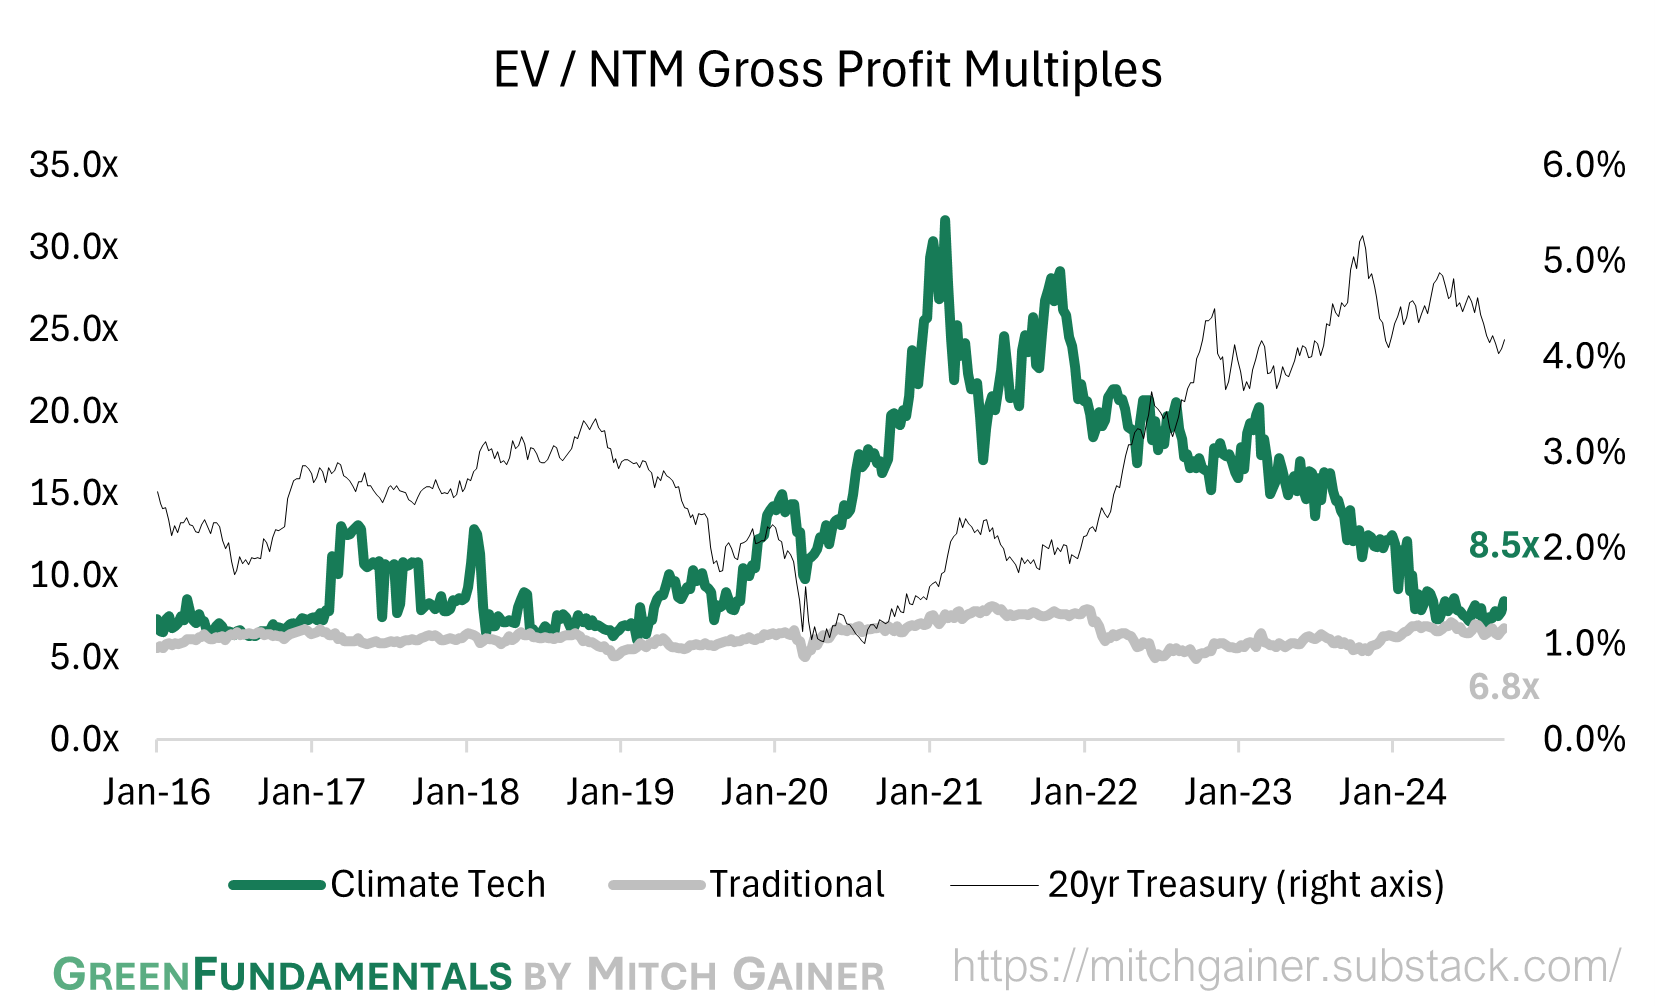
Valuation Multiples over Time

Deep-Dive by Subsector


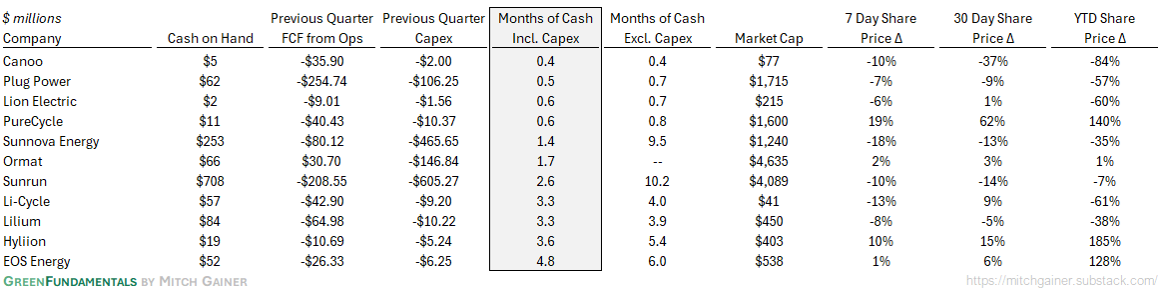
Months of Cash
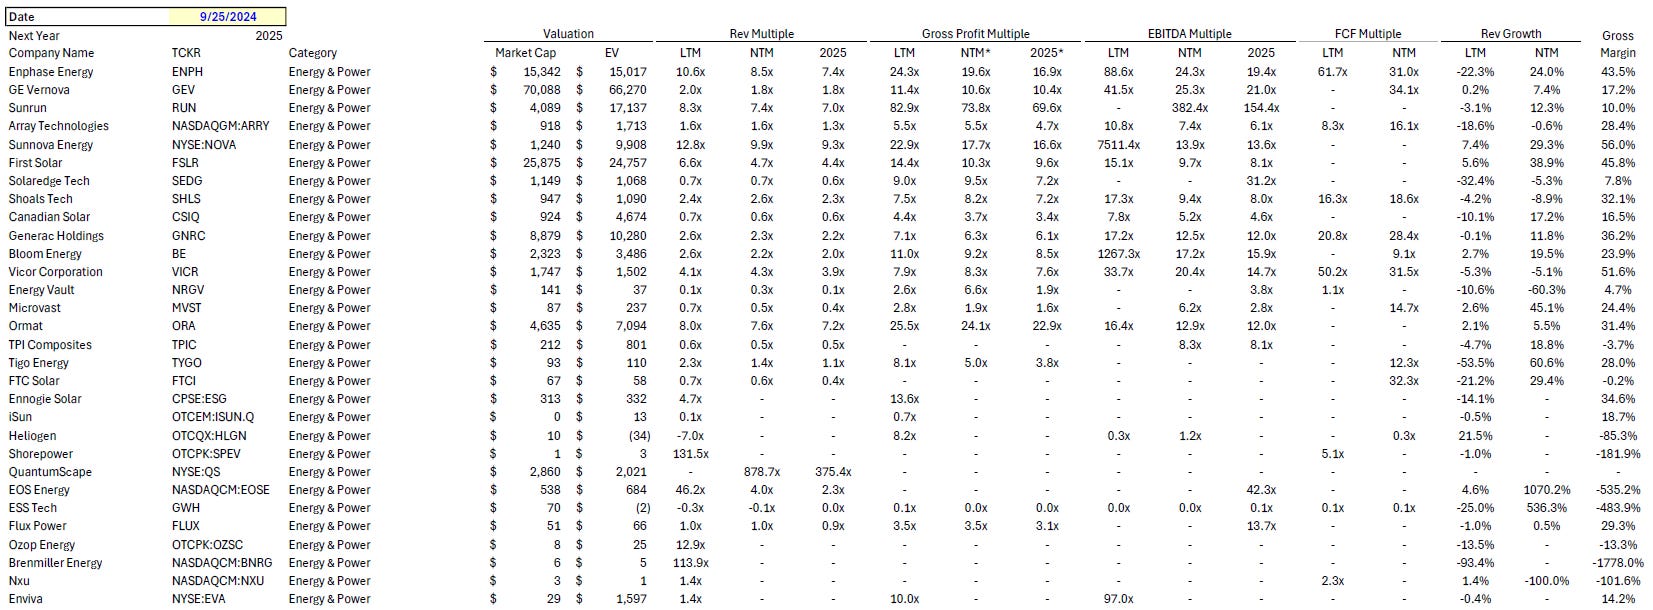
Detailed Comparison Set Data


Sources include news articles cited (above) and publicly available SEC filings.
While technology companies are typically valued on Next Twelve Months (NTM) Revenue, traditional industrial businesses are often valued on Last Twelve Months (LTM) EBITDA. Due to the varied business models across climate tech (and the fact that many of the companies are not yet EBITDA positive) valuation multiples here are calculated based on Next Twelve Months (NTM) Gross Profit.
‘Climate Tech’ includes (1) any pure-play climate technology company that (2) has more than $200M market cap and (3) has positive revenue as well as gross profit (see sector deep dives for full list). ‘Traditional’ includes legacy market participants in relevant sectors (see sector deep dives for full list).
This post and the information presented are intended for informational purposes only. The views expressed herein are the author’s alone and do not constitute an offer to sell, or a recommendation to purchase, or a solicitation of an offer to buy, any security, nor a recommendation for any investment product or service. While certain information contained herein has been obtained from sources believed to be reliable, neither the author nor any of his employers or their affiliates have independently verified this information, and its accuracy and completeness cannot be guaranteed. Accordingly, no representation or warranty, express or implied, is made as to, and no reliance should be placed on, the fairness, accuracy, timeliness or completeness of this information. The author and all employers and their affiliated persons assume no liability for this information and no obligation to update the information or analysis contained herein in the future.