


Green Fundamentals: Spain Felt the Hertz
Data-driven discussion of climate technology, finance, and policy

I provide data-driven climate tech market analysis. Follow along to stay up to date!
This post and the information presented are intended for informational purposes only. They reflect solely the personal opinions of the author in his individual capacity. They do not reflect the views or opinions of any current, past, or future employer, organization, or affiliate.
Spain’s blackout may show frequency, not capacity, to be the grid’s binding constraint
What Happened: A Sudden Collapse in a Grid that Claimed 100% Renewables Days Before
On April 16, Spain declared a milestone: it had powered an entire weekday with 100% renewables between 10 a.m. and 7 p.m. Just twelve days later, that celebration gave way to crisis.
At 12:33 p.m. on April 28, Spain's grid experienced a sharp generation trip, believed to be tied to a large solar installation. Within 1.5 seconds, a second large source failed. By the 3.5-second mark, Spain was disconnected from the European grid as the interconnectors with France tripped offline. Frequency spiraled, cascading through the system. Within seconds, generation across all of Spain collapsed to zero, plunging tens of millions in Spain, Portugal, and parts of France into darkness.
The causes are still under investigation. A cyberattack has not been ruled out, but emerging consensus points to a grid overly reliant on inverter-based renewables without sufficient stabilizing assets.

Understanding Grid Frequency: Inertia, Inverters, and the Role of Fast Response
Electric grids operate at a nominal frequency of 50 Hz in Europe (60 Hz in North America). To maintain this frequency, generation and consumption must be perfectly balanced in real time.
Historically, this balance was supported by synchronous generators (coal, gas, nuclear, hydro) that contribute mechanical inertia—large rotating turbines that resist frequency change, absorbing shocks and buying time when the system deviates.
But solar and wind power connect through inverters, not spinning turbines. They lack inertia and do not naturally stabilize frequency. As these inverter-based resources dominate, frequency regulation becomes an ancillary service, increasingly provided by grid-scale batteries or synthetic inertia devices.
The grid also includes automatic protection mechanisms—if frequency dips too far, relays disconnect load or trip generators to avoid physical damage. In Spain's case, these protections may have activated too slowly—or too aggressively—accelerating the collapse.
A Vicious Feedback Loop: The Anatomy of a Grid Failure
While the precise sequence is still under investigation, the emerging theory is a classic cascade:
A large generator—likely solar—trips, initiating a sudden drop in frequency.
The grid, with high renewable penetration and minimal inertia, lacks damping. The frequency swings accelerate.
Interconnectors with France trip, isolating Iberia. Spain's grid loses access to balancing support from Europe.
More generators detect instability and trip offline.
Low Frequency Demand Disconnect (LFDD) either fails to trigger fast enough or is overwhelmed.
Within seconds, generation drops to zero. Demand collapses. The grid enters a full blackout.
This is not a failure of solar per se, but a systemic failure to manage renewable integration without adequate balancing services.
Restarting the Grid: Why Restoration Took 10+ Hours
The public’s immediate question—"how can it take 10 hours to turn the lights back on?"—belies the complexity of grid restoration.
Spain lost ~15 GW of load. As of late evening, operators still had over 20 GW to restore:
Network chaos: The grid was left with thousands of tripped breakers, dead substations, and conflicting alarms. Operators had to diagnose the problem amid signal noise.
PV can’t help: Solar can't re-energize a dead grid due to its lack of inertia. Only thermal plants (gas and coal) could provide the black start capability.
Manual restart: Plants had to be manually restarted, segmented into isolated "power islands" that were cautiously synchronized.
Synchronization: Rejoining these islands into one cohesive grid required precise frequency and phase matching.
Equipment limits: Substation battery backups ran low, undermining remote relay operation and requiring manual intervention.
This is why full recovery took a full workday—and why more severe scenarios could take days or weeks without reform.
Market Signals: Frequency Regulation is Becoming a Scarce Commodity
This event is a wake-up call for markets where renewables outpace grid reform:
Frequency services are undervalued: Today, frequency response is often modeled as upside in battery storage projects—not core to investment cases.
Tariff reform lags technology: U.S. market structures (e.g., FERC 841) allow battery participation, but tariffs often don’t reflect full value of frequency stability.
Battery scarcity ahead: As solar continues to scale, the constraint may not be module supply—it may be access to flexible assets like batteries to stabilize and firm output.
Revenue re-rating potential: Existing battery assets could see outsized returns as frequency regulation becomes more critical—and more scarce.
Financing challenge: Investors must reframe batteries not just as arbitrage tools, but as grid stability infrastructure with defensible, non-optional value.
Key Takeaway for Investors: Battery storage may be the most undervalued asset class in the energy transition. Developers with positioned supply chains or tariff-exempt capacity stand to benefit disproportionately as rising renewable penetration and import constraints make frequency regulation a bottleneck, not a bonus.
Spain’s blackout is not just a Southern European crisis—it’s a leading indicator for what could happen anywhere the grid moves faster than the market's ability to value stability.

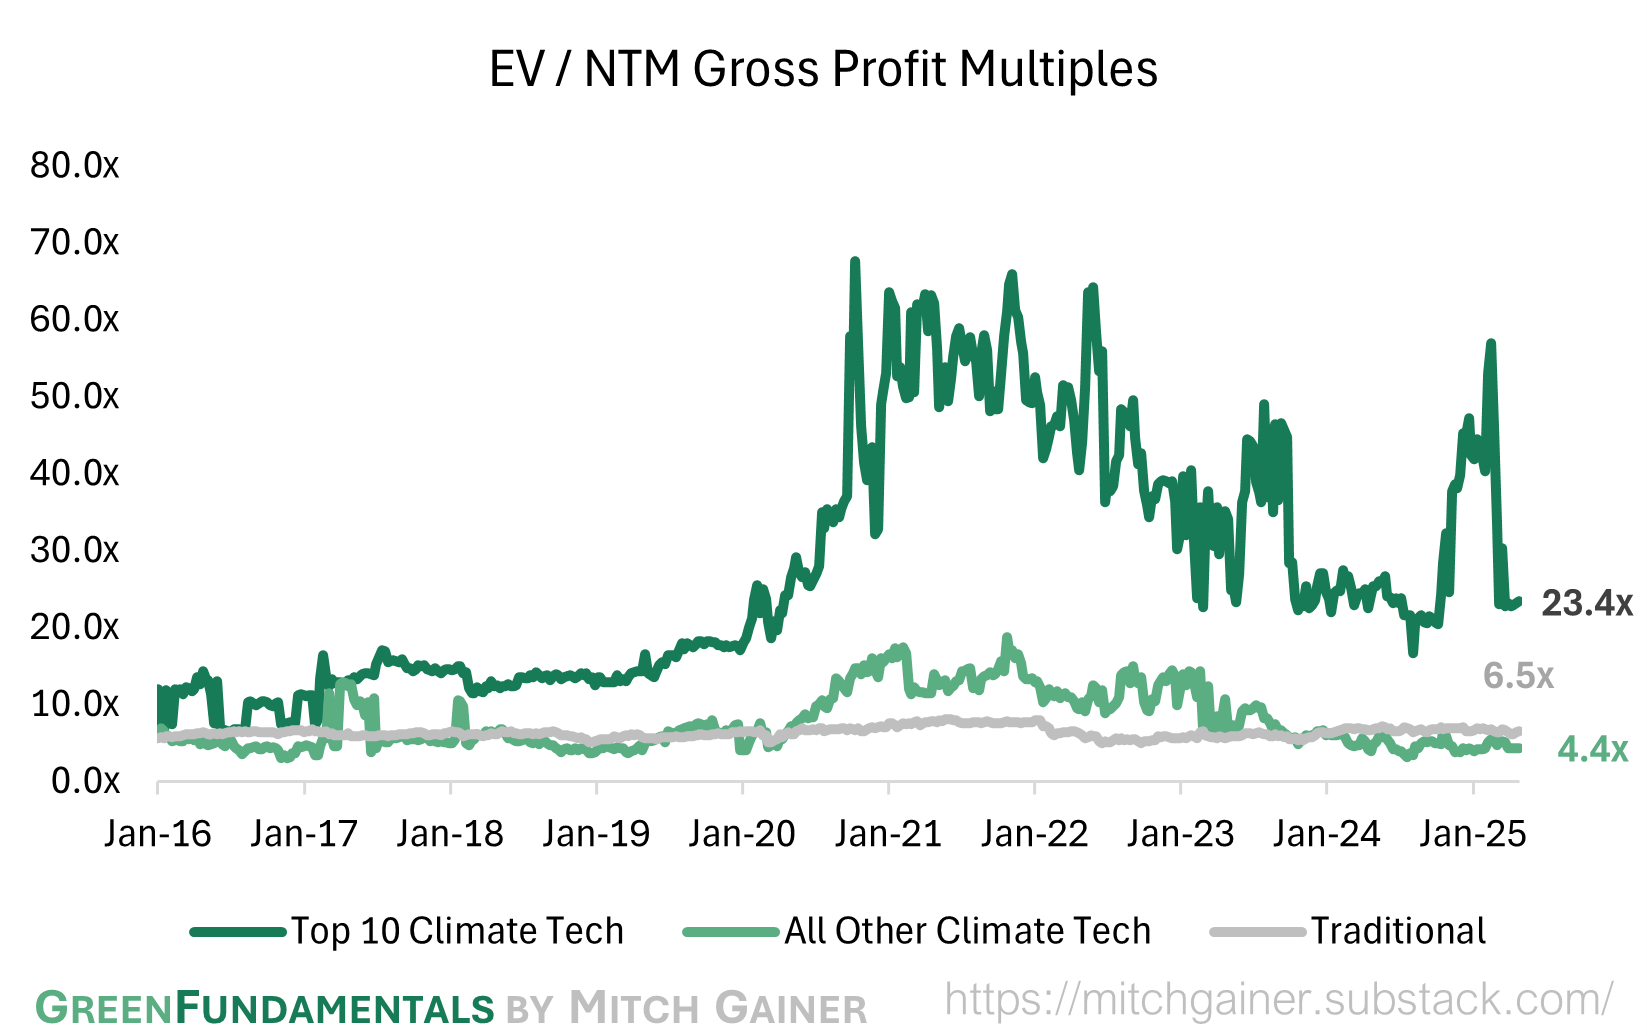
Top 10 EV / NTM Gross Profit Multiples

See footnote for detailed valuation methodology and explanation.1
Top 10 and Bottom 10 Weekly Share Price Movement


Valuation Multiples over Time

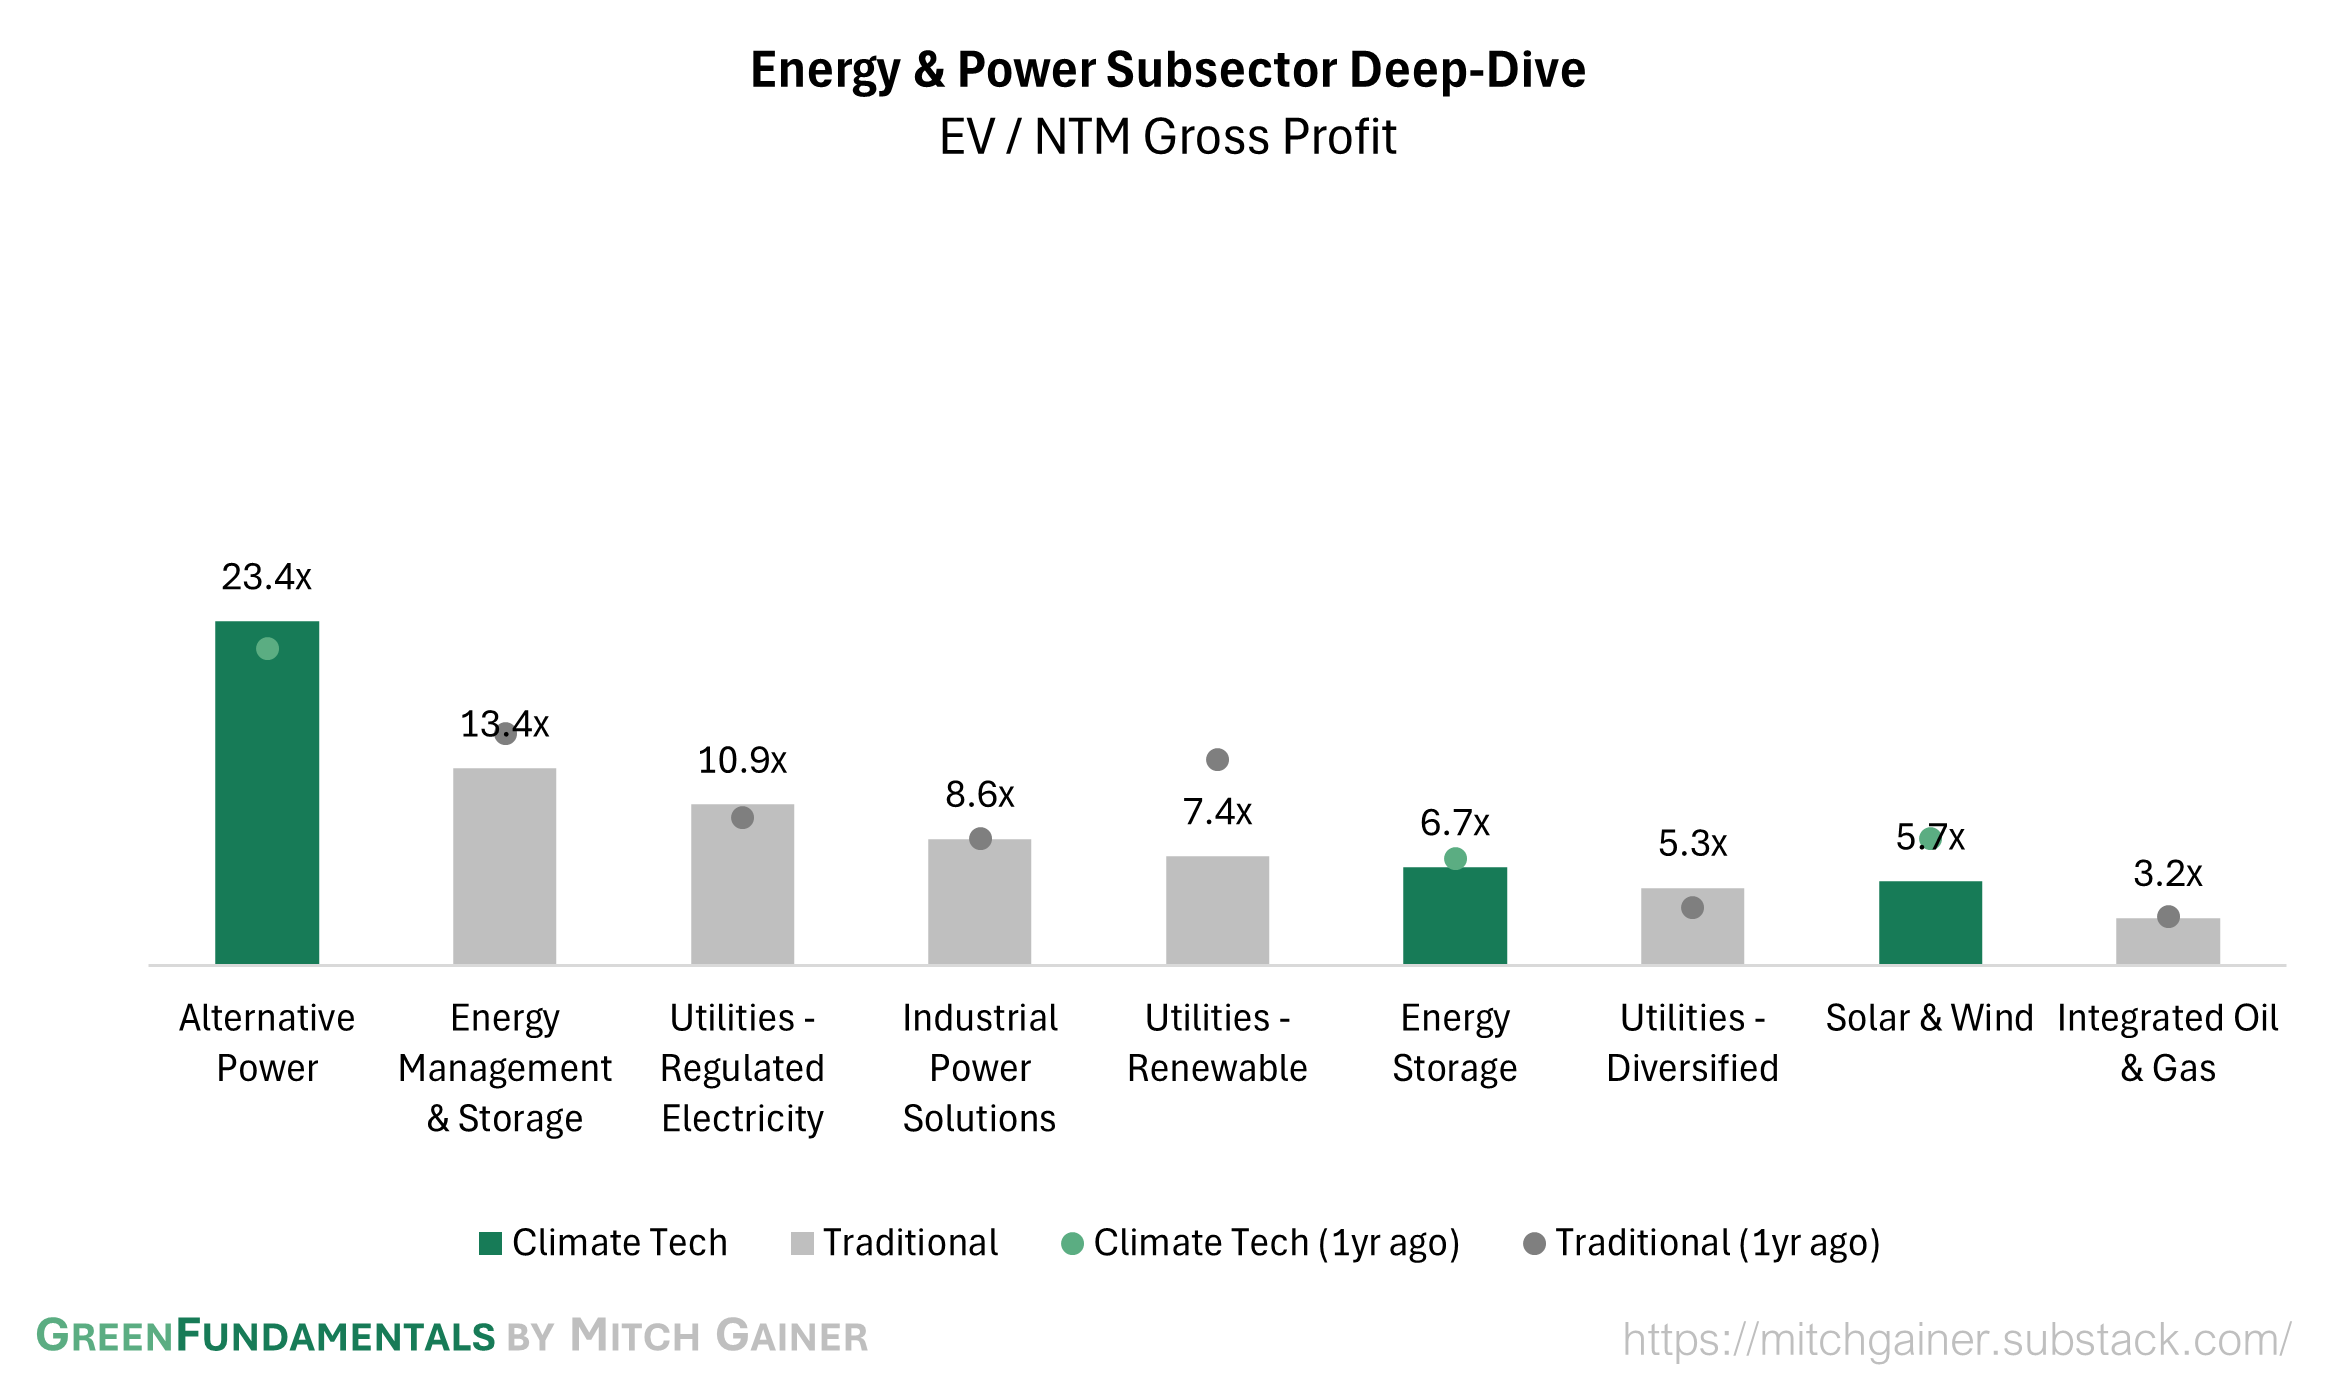
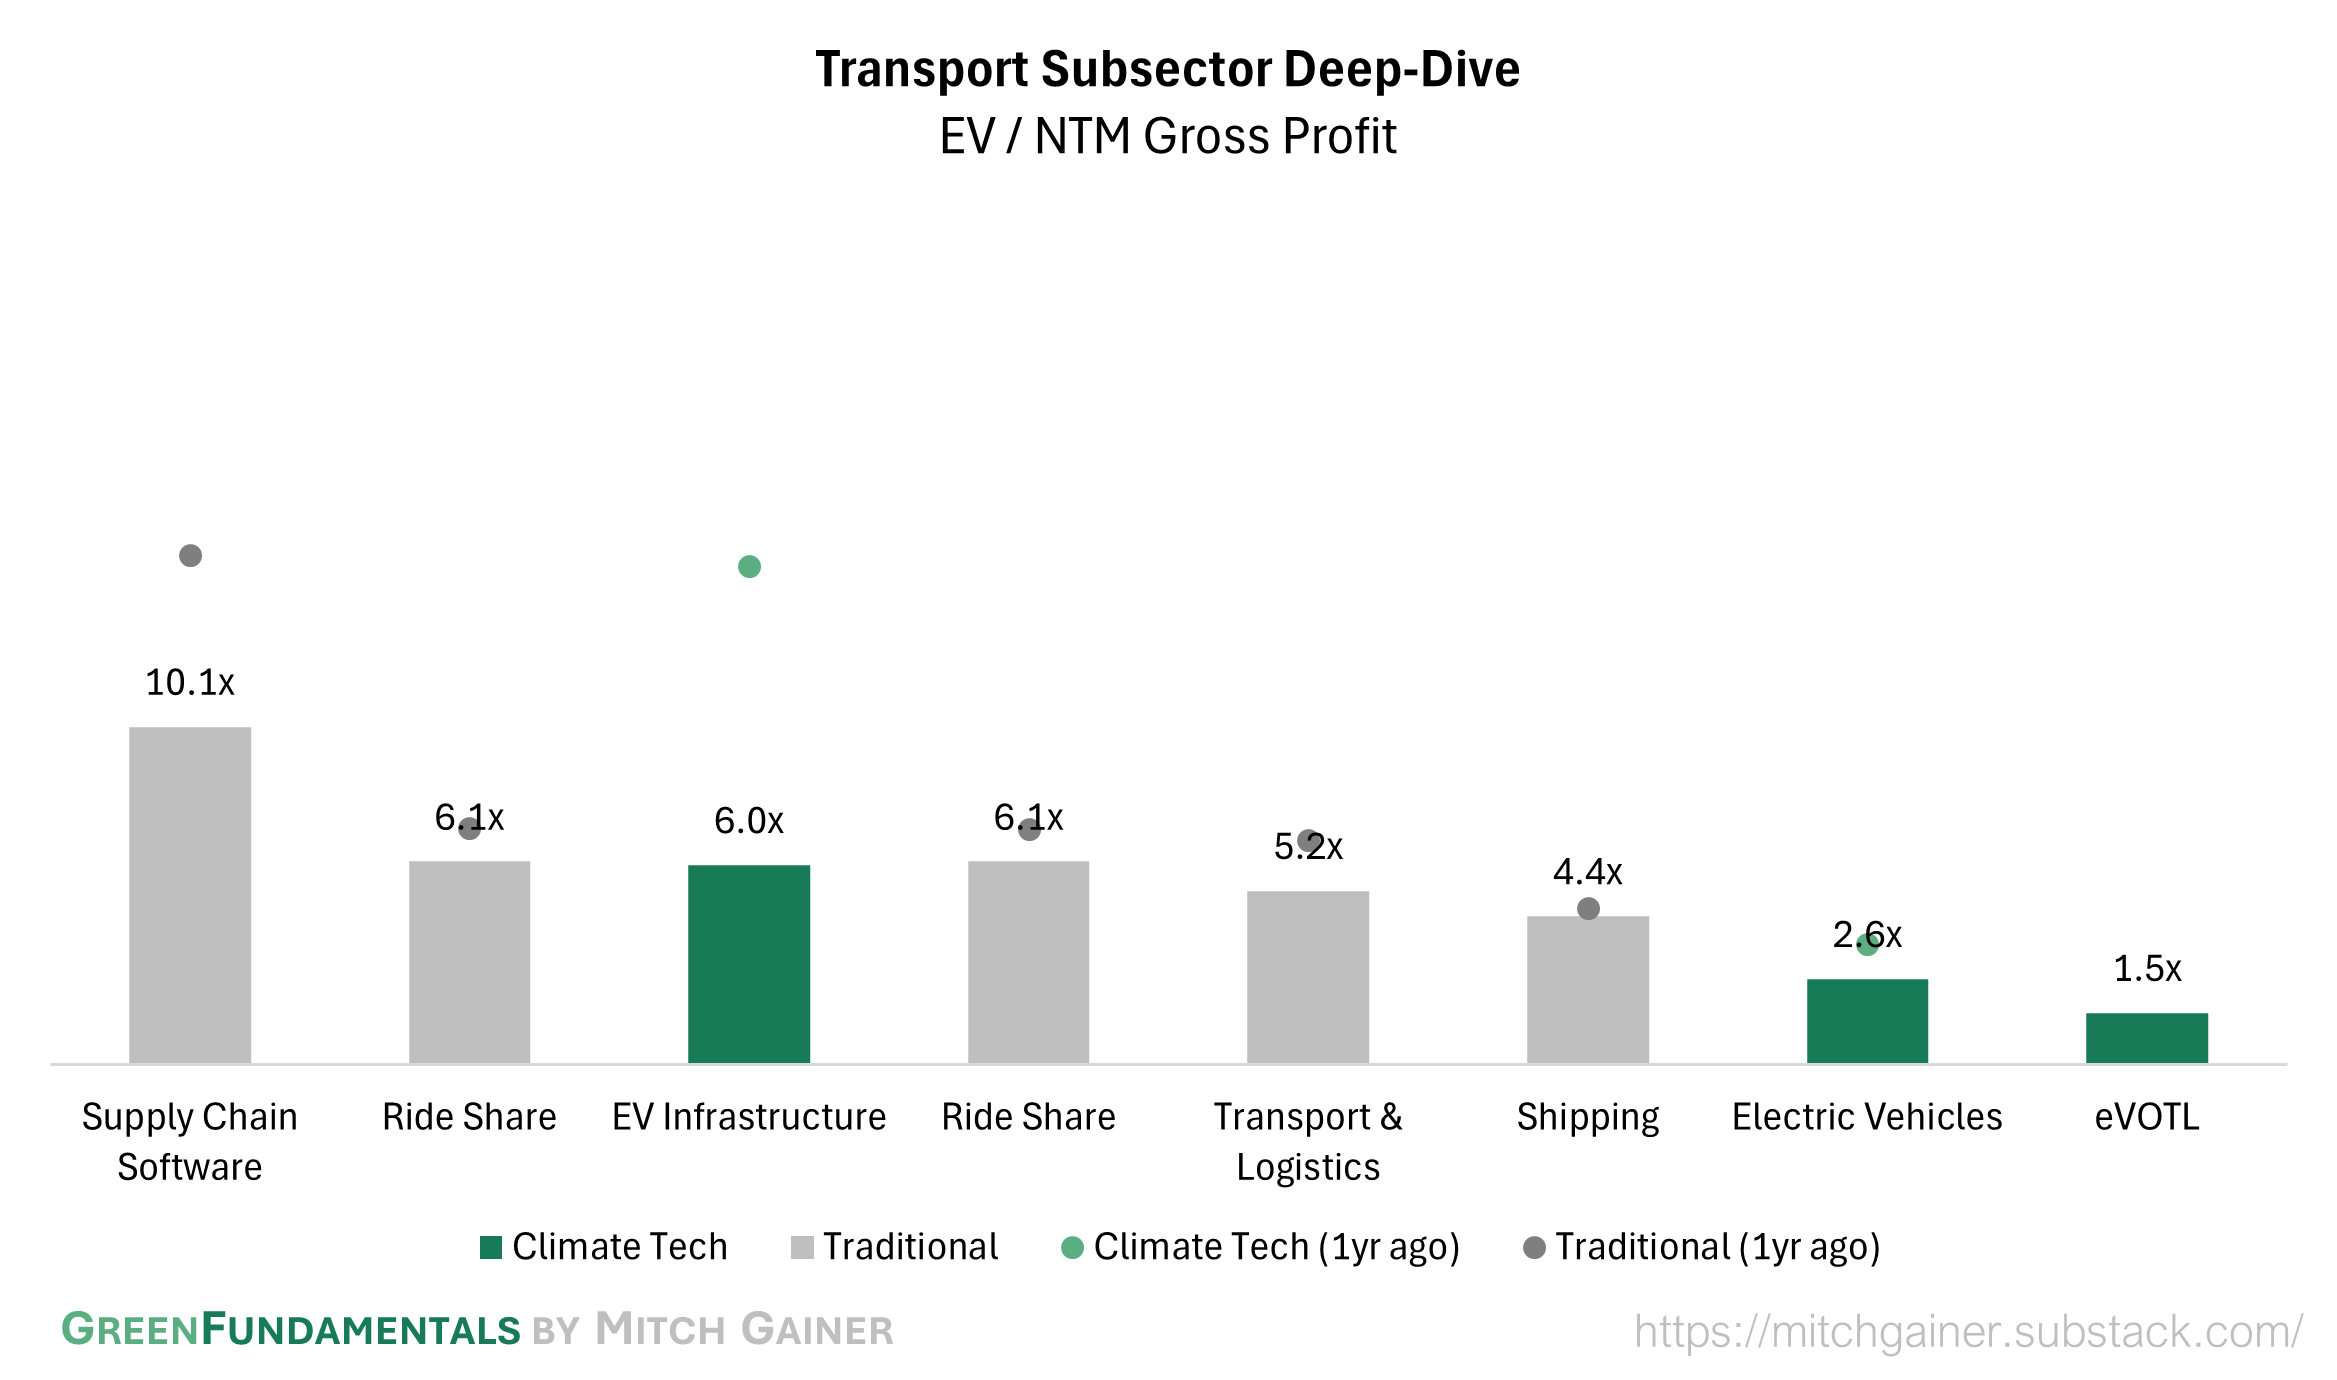
Deep-Dive by Subsector

Detailed Comparison Set Data


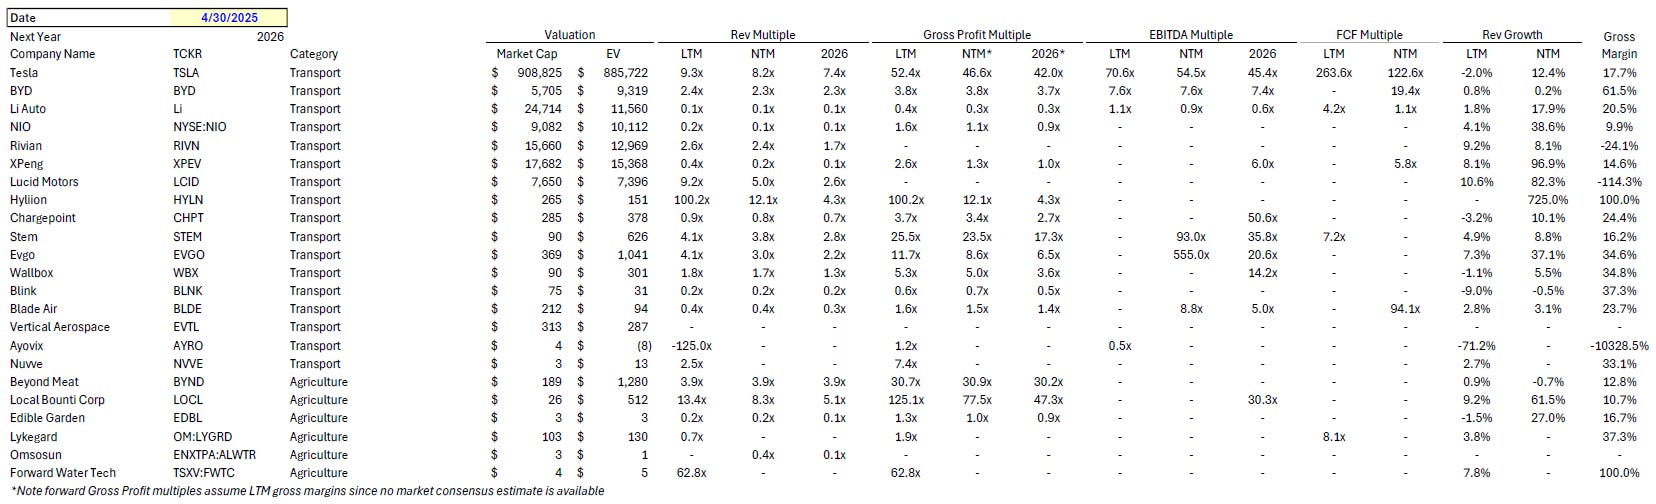
Sources include news articles cited (above) and publicly available SEC filings.
While technology companies are typically valued on Next Twelve Months (NTM) Revenue, traditional industrial businesses are often valued on Last Twelve Months (LTM) EBITDA. Due to the varied business models across climate tech (and the fact that many of the companies are not yet EBITDA positive) valuation multiples here are calculated based on Next Twelve Months (NTM) Gross Profit.
‘Climate Tech’ includes (1) any pure-play climate technology company that (2) has more than $200M market cap and (3) has positive revenue as well as gross profit (see sector deep dives for full list). ‘Traditional’ includes legacy market participants in relevant sectors (see sector deep dives for full list).
This post and the information presented are intended for informational purposes only. They reflect solely the personal opinions of the author in his individual capacity. They do not reflect the views or opinions of any current, past, or future employer, organization, or affiliate. The views expressed herein are the author’s alone and do not constitute an offer to sell, or a recommendation to purchase, or a solicitation of an offer to buy, any security, nor a recommendation for any investment product or service. While certain information contained herein has been obtained from sources believed to be reliable, neither the author nor any of his employers or their affiliates have independently verified this information, and its accuracy and completeness cannot be guaranteed. Accordingly, no representation or warranty, express or implied, is made as to, and no reliance should be placed on, the fairness, accuracy, timeliness or completeness of this information. The author and all employers and their affiliated persons assume no liability for this information and no obligation to update the information or analysis contained herein in the future.