


Green Fundamentals: Tariffs Tumble Climate Tech
Data-driven discussion of climate technology, finance, and policy

I provide data-driven climate tech market analysis. Follow along to stay up to date!
This post and the information presented are intended for informational purposes only. They reflect solely the personal opinions of the author in his individual capacity. They do not reflect the views or opinions of any current, past, or future employer, organization, or affiliate.
Tariffs are no longer a marginal factor—they are materially repricing climate tech equities
Over the past 30 days, public markets have repriced climate technology equities amid intensifying trade friction and deteriorating project economics. Companies with exposure to China-centric supply chains, capital-intensive infrastructure, and weakened pricing power have experienced significant share price declines. Although tariffs served as the immediate catalyst, the underlying structural vulnerabilities were already apparent.
Array Technologies (ARRY -33%): Despite U.S.-based tracker assembly, the company's reliance on foreign steel has led to higher input costs. Project delays and softening order volumes are weighing on margins and dampening investor sentiment. While most contracts are refreshable under EPC structures, volume uncertainty remains a headwind.
Canadian Solar (CSIQ -28%): With operations spanning China, Southeast Asia, and North America, Canadian Solar is uniquely positioned yet increasingly constrained. Tariffs on Southeast Asian modules are compressing U.S. project margins and forcing a strategic reassessment of regional production allocations.
Bloom Energy (BE -26%): Bloom’s diversified global supply chain includes critical exposure to India and Taiwan. Tariffs now apply not only to direct imports but also to upstream components. While the company has emphasized its ability to raise prices, investor confidence is being eroded by slower international sales cycles and margin contraction.
Enphase (ENPH -19%): Enphase has made progress in localizing inverter production, but remains exposed to Chinese battery packs, which now face 54% import tariffs. Rising system costs, compounded by high interest rates, are diminishing residential solar demand and straining the company's lease-based business model.
Chrysos Corp (C79 -16%): As a provider of gold assay technologies, Chrysos is indirectly affected by the pullback in mining capital expenditures. Inflationary pressures and trade-related cost increases are delaying upstream mining investments, thereby reducing demand visibility for Chrysos solutions.
XPeng (XPEV -24%) / Li Auto (LI -17%) / NIO (NIO -30%): Chinese electric vehicle (EV) manufacturers are experiencing pricing uncertainty related to trade actions, alongside weakening U.S. and European demand. Even domestic sales in China are beginning to plateau, compounding revenue risk.

Source: Capital IQ
Solar: Tariffs Reshape Mid-Construction Economics
The reintroduction of aggressive tariffs has once again disrupted U.S. solar construction timelines. Although approximately 55 GW of panel inventory will support first-half 2025 installations, developers face potential pricing shocks and margin erosion in the second half.
Modules sourced from Vietnam (46% tariff), Cambodia (49%), Malaysia (24%), and Thailand (36%) have already seen import volumes collapse. Chinese crystalline silicon panels now face effective duties of 54% when accounting for new tariffs and existing anti-dumping/countervailing duties (AD/CVD). As a result, domestic panel pricing is trending toward $0.30–$0.35/W, with further upside risk from aluminum and logistics costs.
Developers are renegotiating power purchase agreements (PPAs) and delaying new project commitments. Vertically integrated U.S. suppliers with established pricing protections are positioned to benefit.
Batteries: From Commodity Volatility to Trade-Driven Price Shocks
While lithium prices drove cost volatility in 2022–2024, the current cycle is defined by policy-driven cost escalation. Chinese lithium iron phosphate (LFP) cells, which remain the global marginal price setters, are now subject to 35–60% tariff-related premiums. Anode active materials (AAM) face proposed AD/CVD duties of up to 200%.
Clean Energy Associates forecasts a 35% year-over-year increase in containerized battery energy storage system (BESS) prices. These estimates exclude installation and software costs, which are also expected to rise. U.S. market participants anticipating an Inflation Reduction Act-driven reshoring wave must now contend with a supply gap, as most domestic and Southeast Asian cell plants will not reach commercial scale until 2026–2027.

Source: Clean Energy Associates
Electrical Equipment: Relative Stability in a Volatile Market
Unlike solar and storage, grid-oriented electrical equipment suppliers remain largely insulated from tariff shocks. Companies such as Shoals (SHLS) benefit from component sourcing in North America under the U.S.-Mexico-Canada Agreement (USMCA). Their supply chains are diversified, and copper input prices have remained relatively stable.
Nonetheless, steel, aluminum, and specialty materials such as fuses and resins are trending upward. While second-half 2025 may bring modest margin pressure, most leading firms in this segment operate under contractual structures that allow for pricing adjustments.
EV MARKET: Chinese Automakers Face Rising Barriers
The new tariff regime is profoundly impacting Chinese EV manufacturers, particularly XPeng, NIO, and Li Auto, which already contend with softening U.S. and European demand. Tariffs on Chinese-origin EVs are expected to increase from the previous 27.5% baseline to nearly 100% effective rates when accounting for new penalty tariffs introduced in 2025. The impact is twofold: direct cost escalation for vehicles entering the U.S. and a chilling effect on expansion plans in Western markets.
XPeng, Li Auto, and NIO have all seen declines exceeding 25–35% over the past month, reflecting a combination of tariff-related cost uncertainties and weakening consumer appetite. Companies have announced strategic pivots to prioritize Southeast Asia and Middle Eastern markets, but these geographies cannot fully offset lost margin opportunities in the U.S. and Europe. Moreover, battery supply chains remain China-centric, meaning additional tariffs on battery cells and components further undermine the unit economics of exported vehicles.
The longer-term implication is a slowdown in Chinese EV market share growth outside of Asia and a potential increase in localized production efforts, particularly in Europe. However, near-term risks to revenue, margin, and valuation remain material.
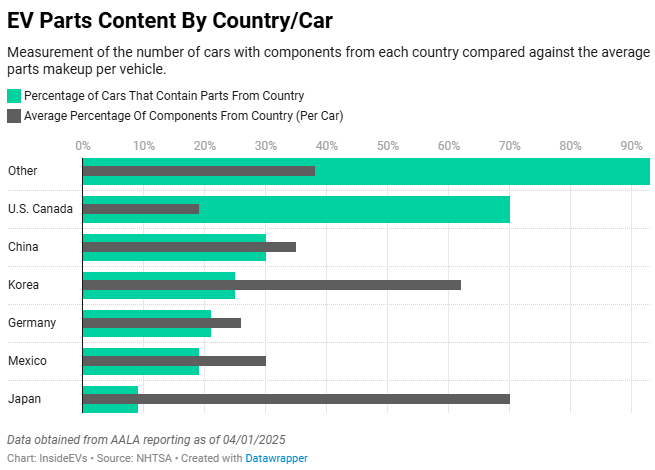
Source: InsideEVs
Macro Implications: Reassessing the Climate Investment Thesis
The evolving trade environment is testing two core assumptions:
That U.S. industrial policy can effectively substitute for global cost advantages.
That climate technology firms can maintain pricing power despite tightening macroeconomic conditions.
For institutional investors, the strategic implications are clear:
Prioritize companies with domestic or tariff-immune cost structures.
Deprioritize firms reliant on Southeast Asian modules, Chinese battery cells, or AD/CVD-sensitive inputs.
Monitor Q2 earnings for signs of project delays, PPA repricing, and margin deterioration—particularly in solar and storage.
While recent developments do not invalidate the long-term growth trajectory of the energy transition, they do demand a recalibration of risk-adjusted return expectations. The investable opportunity remains, but it now requires more rigorous analysis and selective exposure.

Top 10 EV / NTM Gross Profit Multiples

See footnote for detailed valuation methodology and explanation.1
Top 10 and Bottom 10 Weekly Share Price Movement


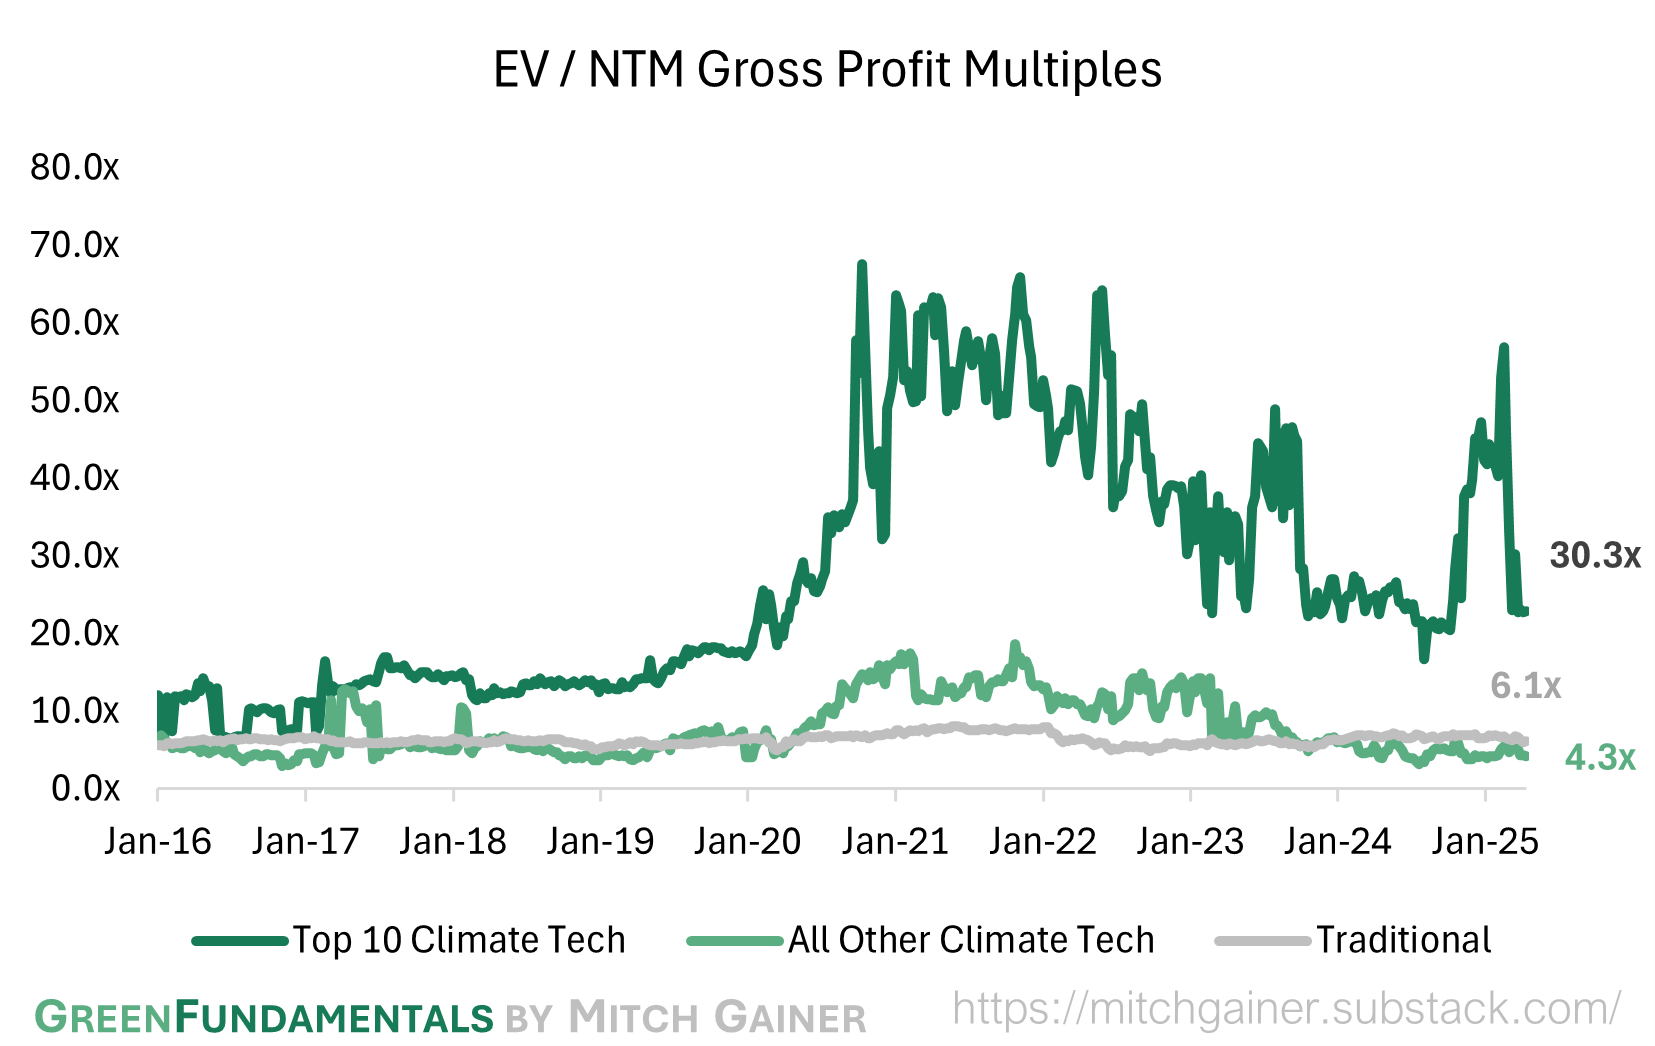
Valuation Multiples over Time

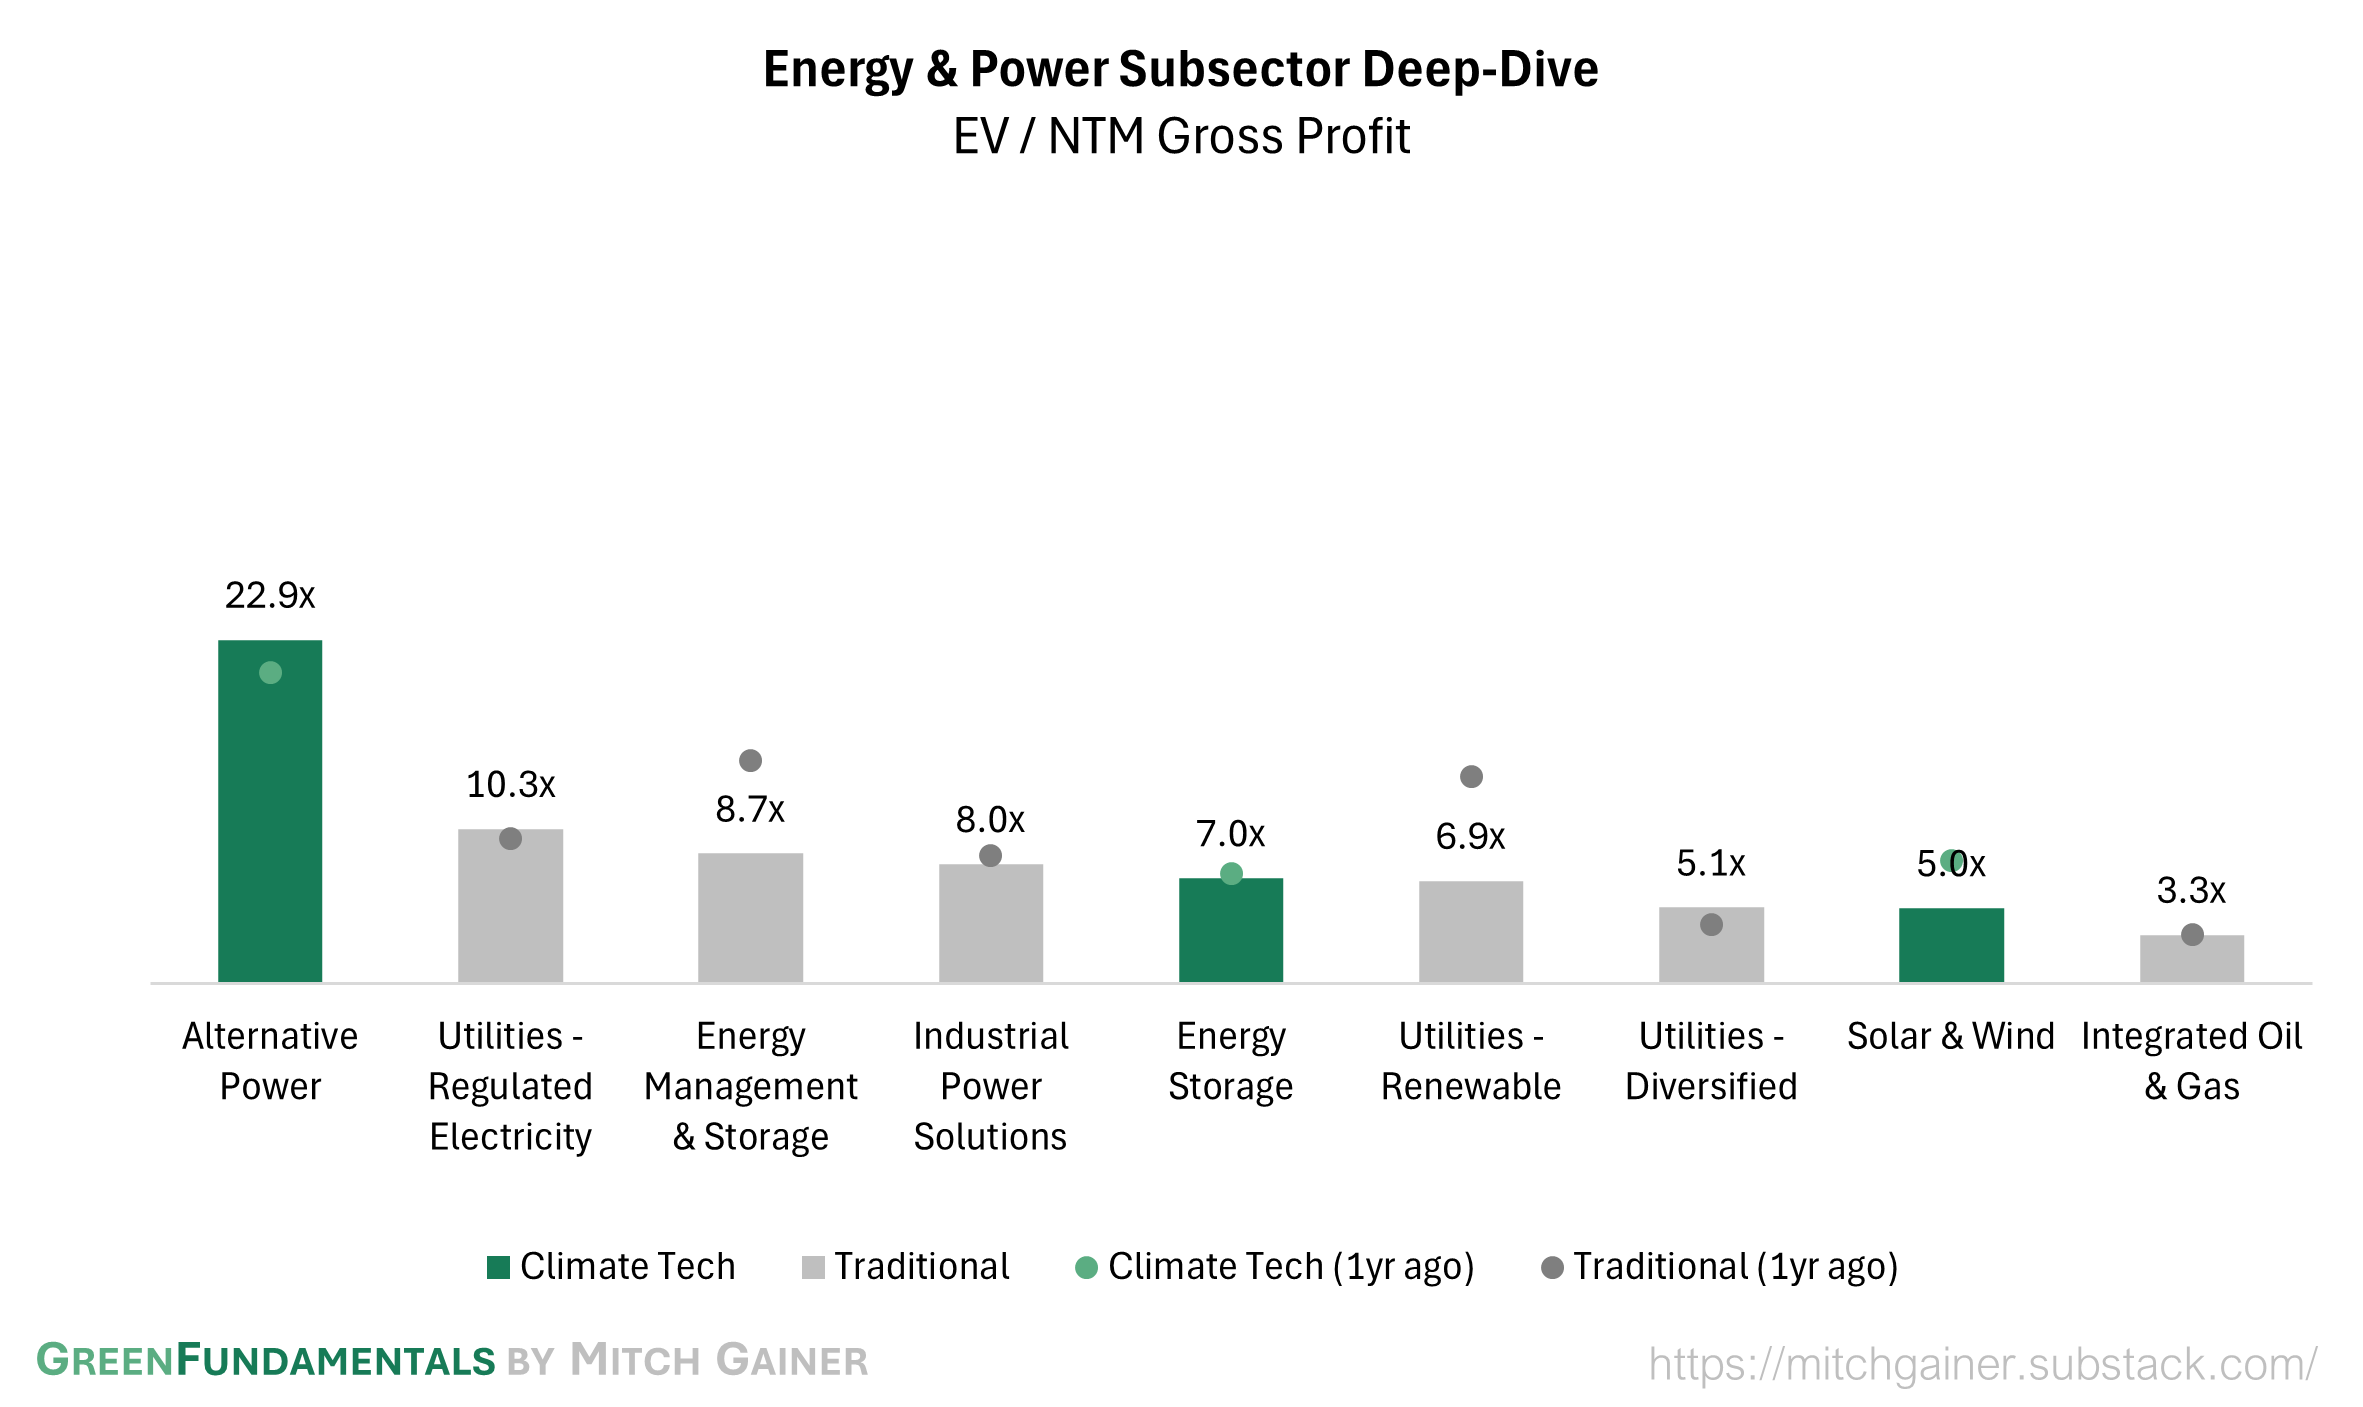
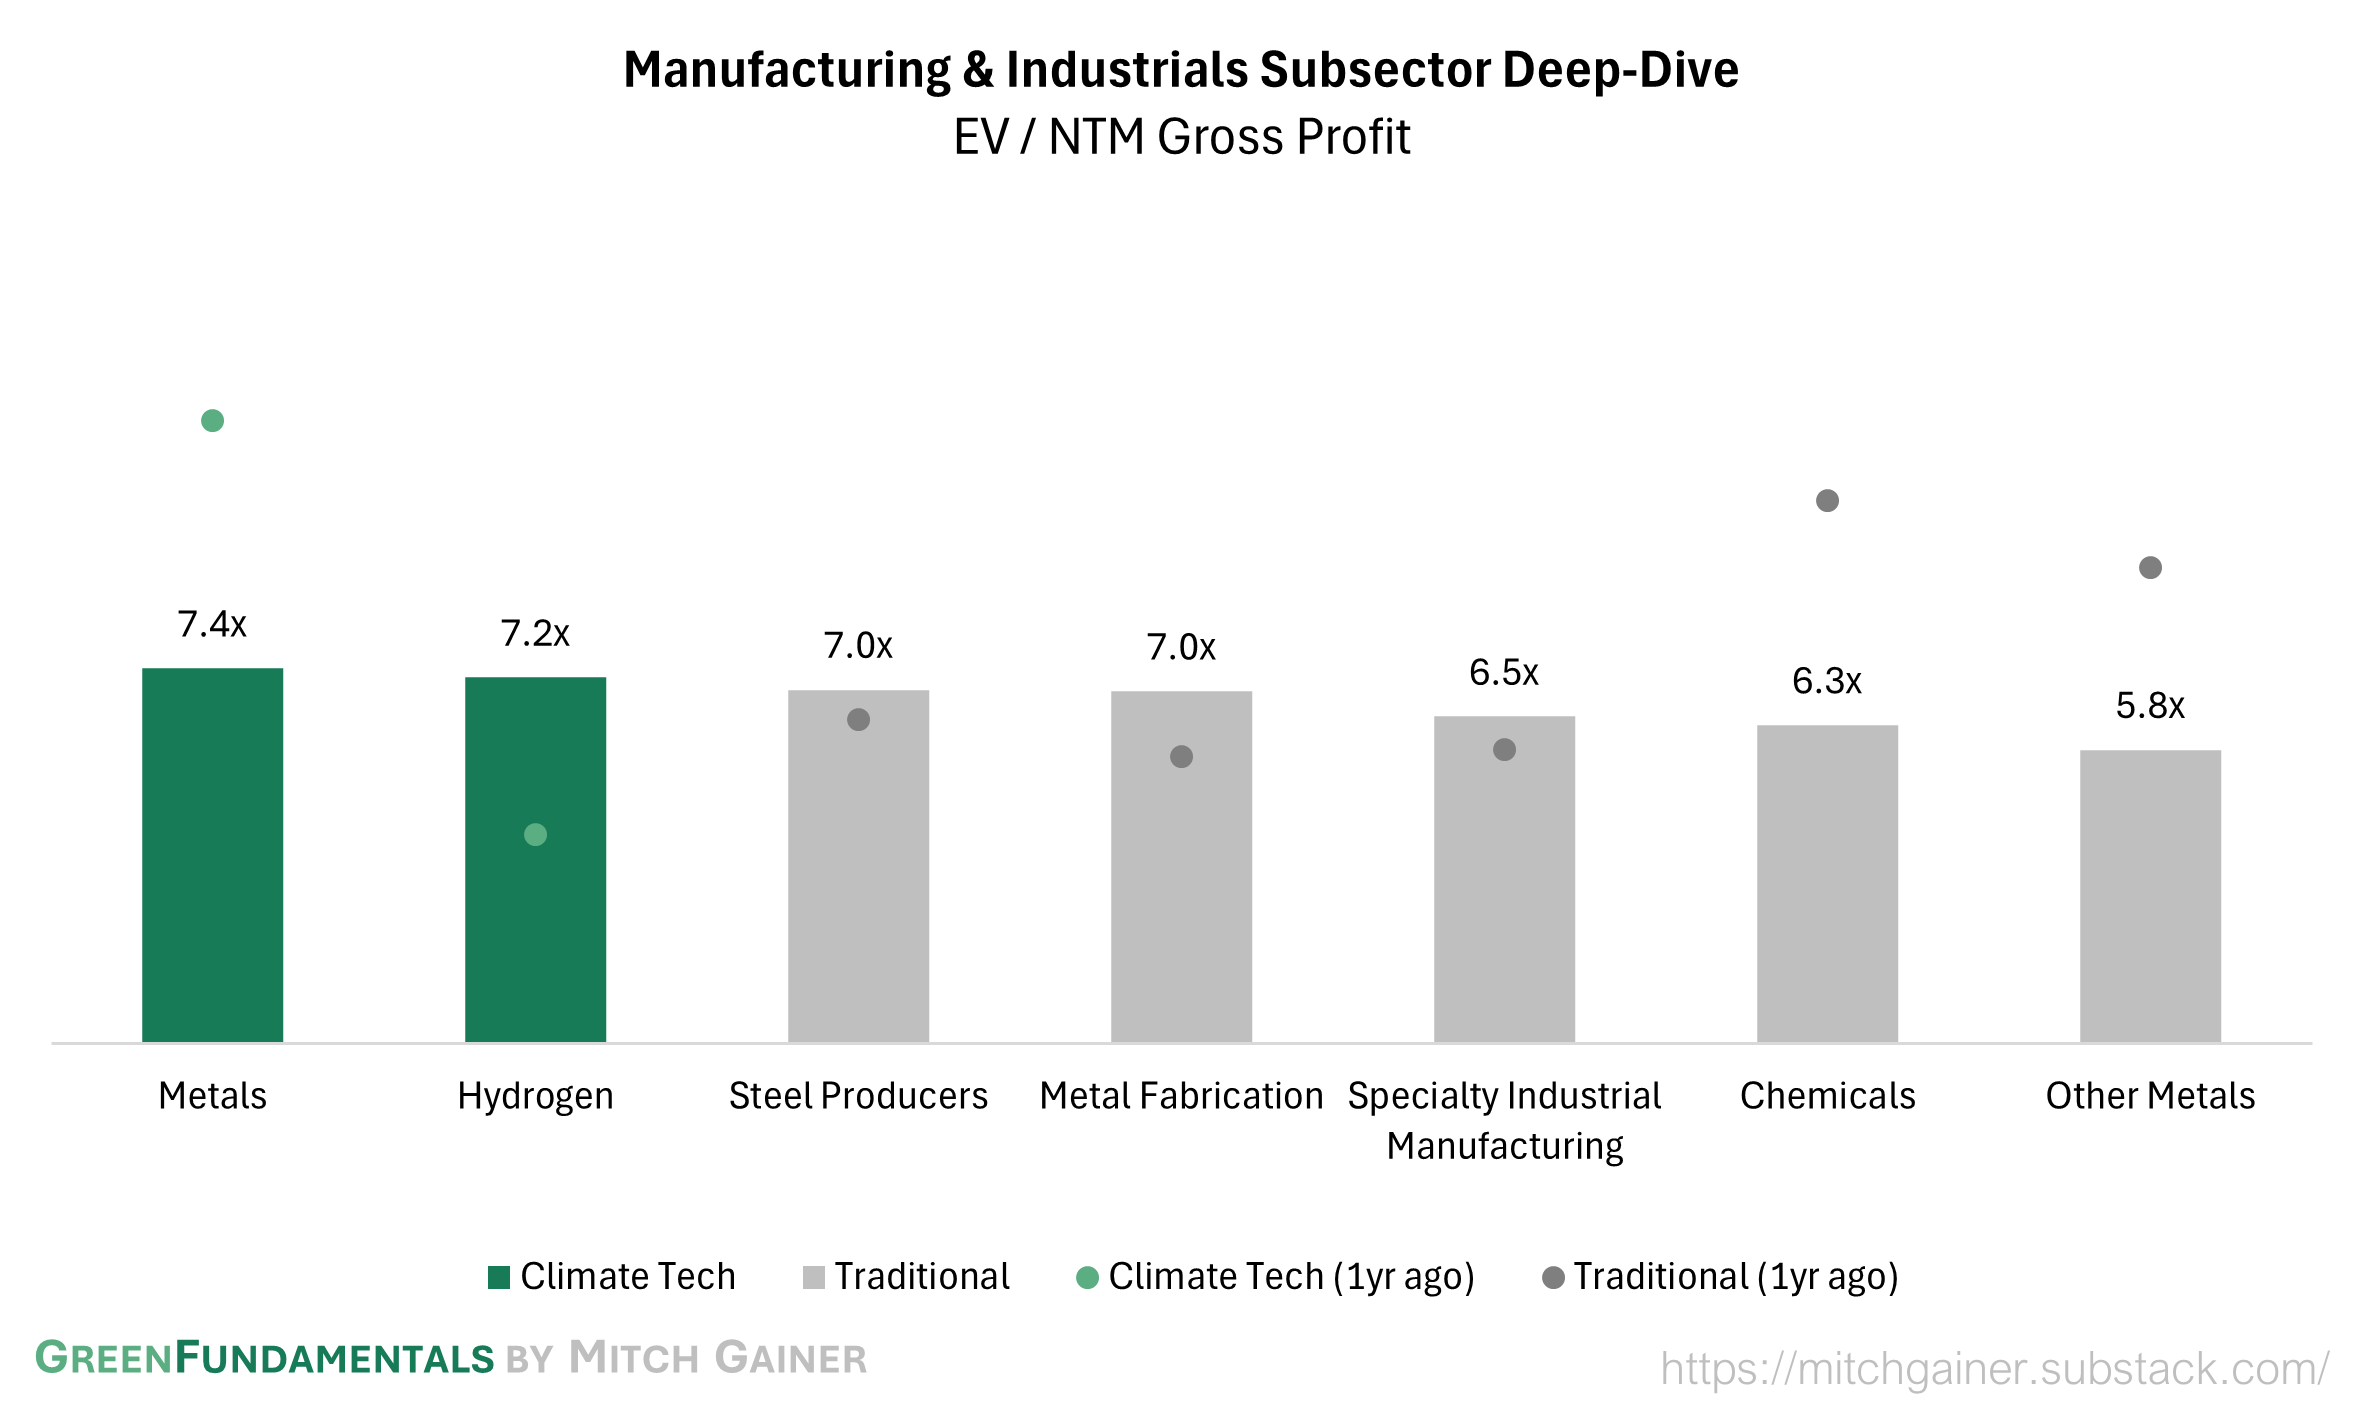
Deep-Dive by Subsector

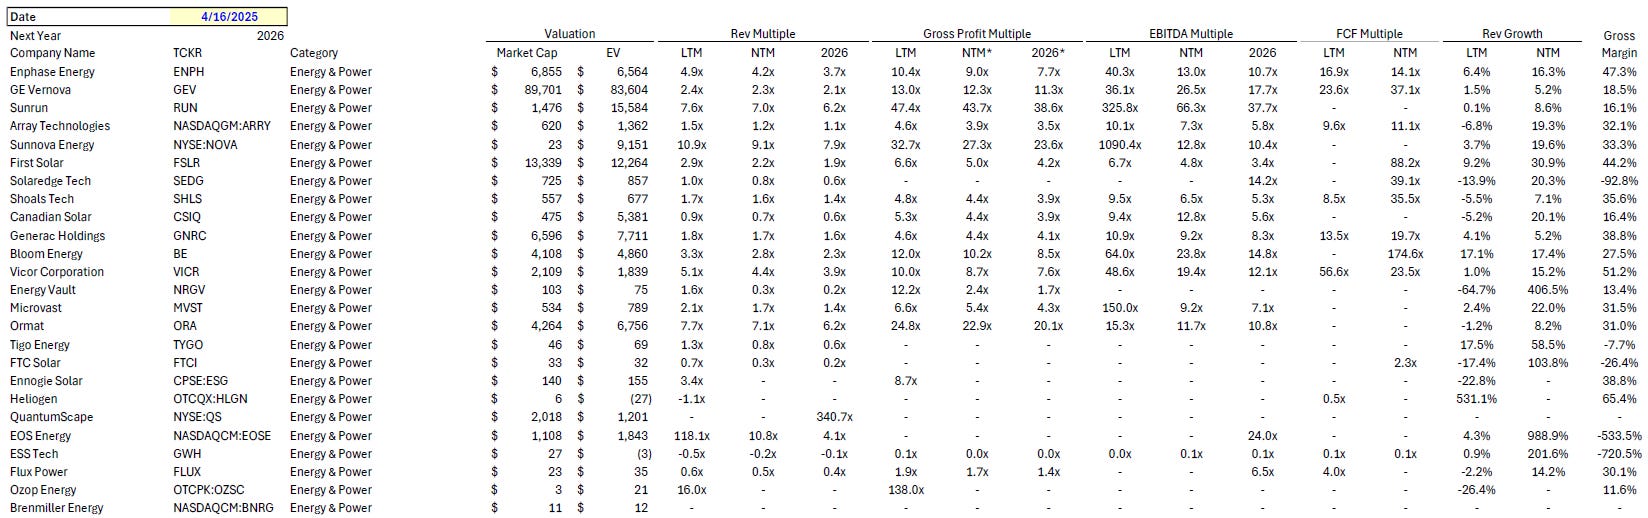
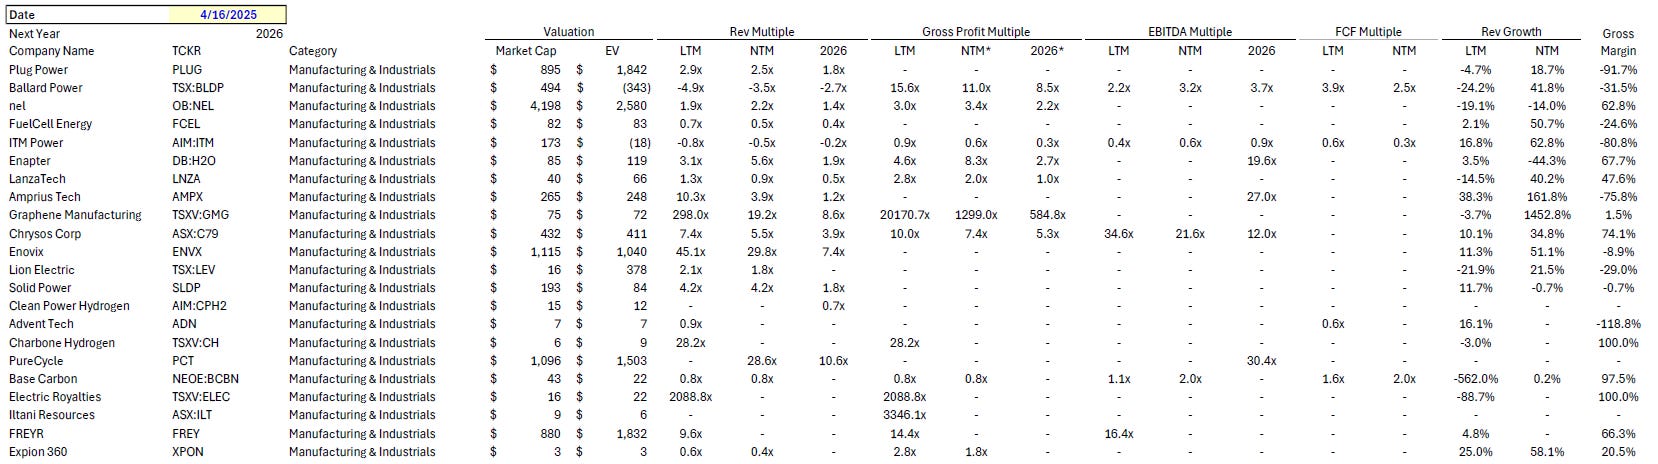
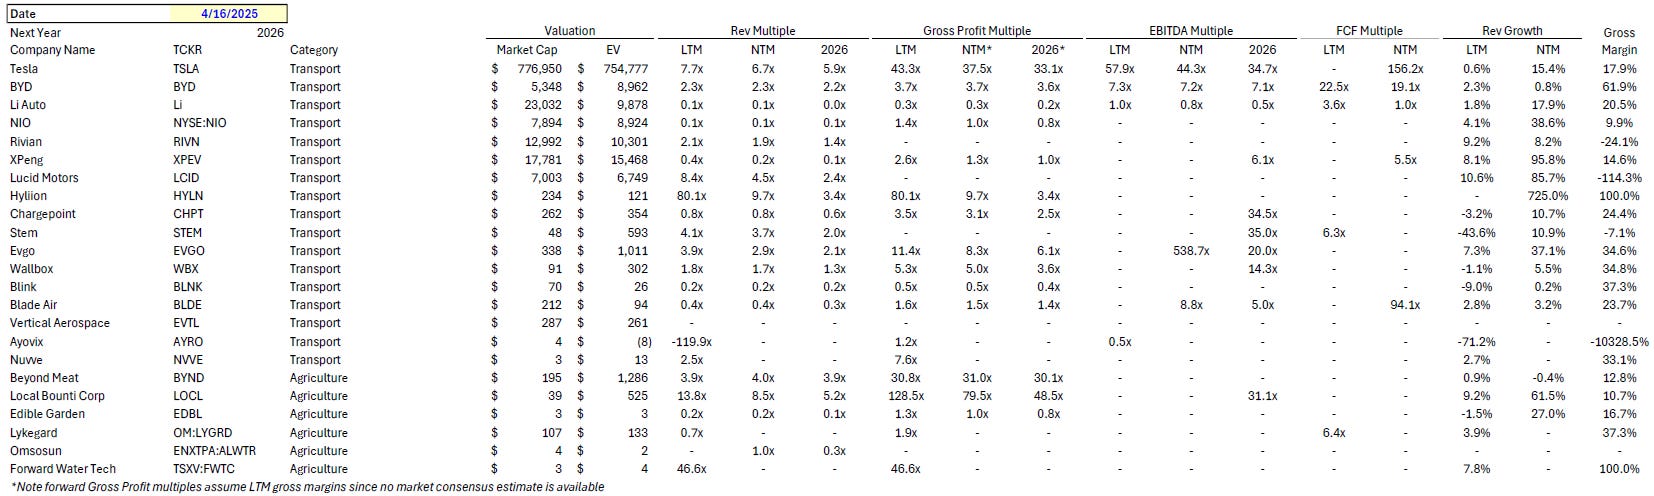
Detailed Comparison Set Data
Sources include news articles cited (above) and publicly available SEC filings.
While technology companies are typically valued on Next Twelve Months (NTM) Revenue, traditional industrial businesses are often valued on Last Twelve Months (LTM) EBITDA. Due to the varied business models across climate tech (and the fact that many of the companies are not yet EBITDA positive) valuation multiples here are calculated based on Next Twelve Months (NTM) Gross Profit.
‘Climate Tech’ includes (1) any pure-play climate technology company that (2) has more than $200M market cap and (3) has positive revenue as well as gross profit (see sector deep dives for full list). ‘Traditional’ includes legacy market participants in relevant sectors (see sector deep dives for full list).
This post and the information presented are intended for informational purposes only. They reflect solely the personal opinions of the author in his individual capacity. They do not reflect the views or opinions of any current, past, or future employer, organization, or affiliate. The views expressed herein are the author’s alone and do not constitute an offer to sell, or a recommendation to purchase, or a solicitation of an offer to buy, any security, nor a recommendation for any investment product or service. While certain information contained herein has been obtained from sources believed to be reliable, neither the author nor any of his employers or their affiliates have independently verified this information, and its accuracy and completeness cannot be guaranteed. Accordingly, no representation or warranty, express or implied, is made as to, and no reliance should be placed on, the fairness, accuracy, timeliness or completeness of this information. The author and all employers and their affiliated persons assume no liability for this information and no obligation to update the information or analysis contained herein in the future.